Crypto Trading 101 | Technical Analysis in Tradingview
Would you like to get to know more about Technical Analysis to become better in predicting which way the markets are heading?
TradingView is a data provider in which you can do Technical Analysis and send buy and sell signals to your trading bot by using the Cryptohopper TradingView TradingView app by using a webhook URL for your trading bot. In this blog we will explain how to spot Support and Resistance levels and how you can check Technical Indicators.
Support and Resistance
Have you ever wondered what support and resistance levels are and how you can spot them? In this blog we will explain the basics of support and resistance levels and how to draw them in TradingView. With Cryptohopper’s TradingView app you can even send buy and sell signals to your own bot!
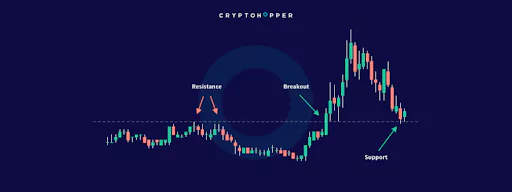
Support and resistance levels are arguably the most simple, common and potentially useful “indicators” when analyzing a chart. It basically consists of drawing lines in the most recent and important maximums and minimums.
But, how do we know that a certain maximum/minimum is a key one to be considered a resistance or support? Volume here plays an important role.
Maximum or minimums that imply higher volume are considered stronger resistances/supports. They are zones where the price is more likely to stop, and in the case of breaking it, to make a pull-back and continue its way up or down.
Moreover, the number of times that the price bounces against a resistance/support also suggests that the resistance line will be harder to break.
Most of the trading strategies, even though they use multiple technical indicators, take into account short, medium and long-term supports and resistances due to they are key factors determining the future path of the price.
Now, you might wonder what makes these supports and resistances so strong. It might seem difficult and even stupid, but is very simple. It is because other investors all around the globe think that the price might stop where the price previously created a minimum or maximum, making it bounce on these zones. This is the so-called self-fulfilling prophecy.
The first step is going to www.tradingview.com, a free account already gives you the option to check out all the basic things you need to research the charts of your trading pairs.
Search for a trading pair in the search bar and select the trading pair that is on the exchange you’re trading on.
You will now see a simple chart of your selected market, click on ‘’Full-featured chart’’ to proceed.
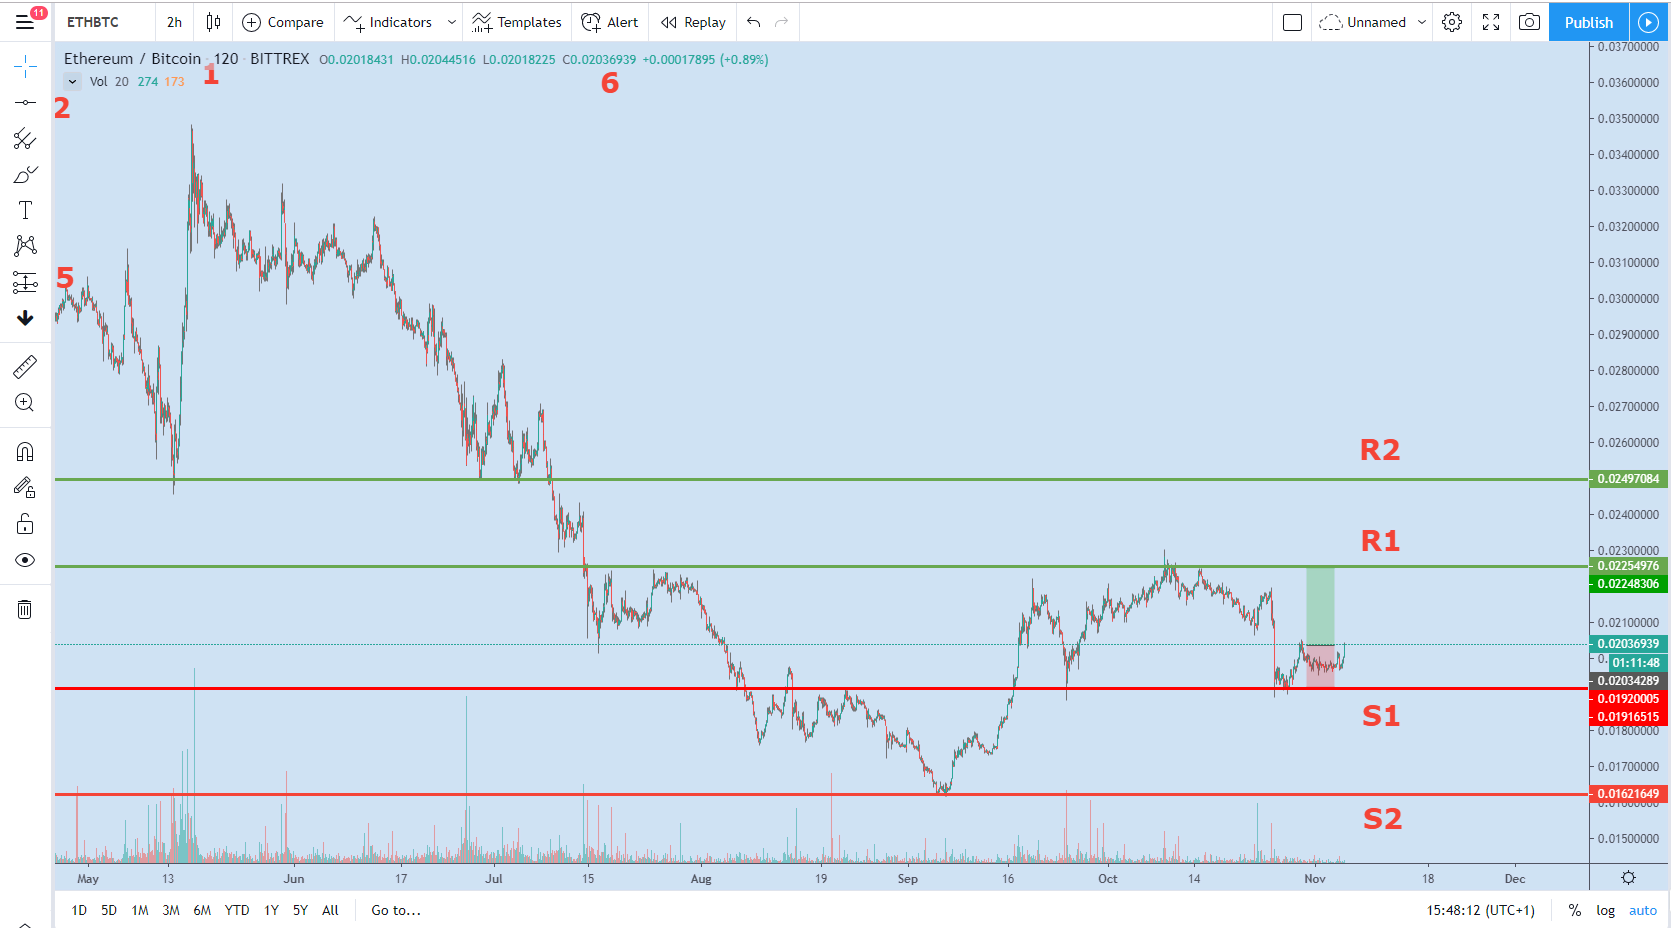
In our example, we use the trading pair ETH/BTC on Bittrex.
Shows the trading pair and exchange you’ve selected.
Shows the spot where you can select horizontal lines and other markers.
R1 and R2 show the resistance levels.
S1 and S2 show the support levels.
Shows how much potential profit you can get on a long or short position.
Shows additional options for the horizontal line, including creating an alert that can be used to send a buy or sell signal to your trading bot!
Technical Indicators
In Cryptohopper’s strategy designer, you can choose over 130 Technical Indicators and Candle Patterns.
These Technical Indicators and Candle patterns help you with determining the right moment to buy and sell.
A full list of the Technical Indicators and Candle Patterns that we already support can be found here, including explanations of how they work.
Go to www.tradingview.com, search for a trading pair in the search bar and click on the exchange you’re trading on.
You will now see a simple chart of your selected market, click on ‘’Full-featured chart’’ to proceed.
In our example, we will select the trading pair ETH/USDT on Binance. Since these are just the basics, we explain the most important features that can be used for Cryptohopper.
In the screenshot below, a couple of features are numbered and will be explained.
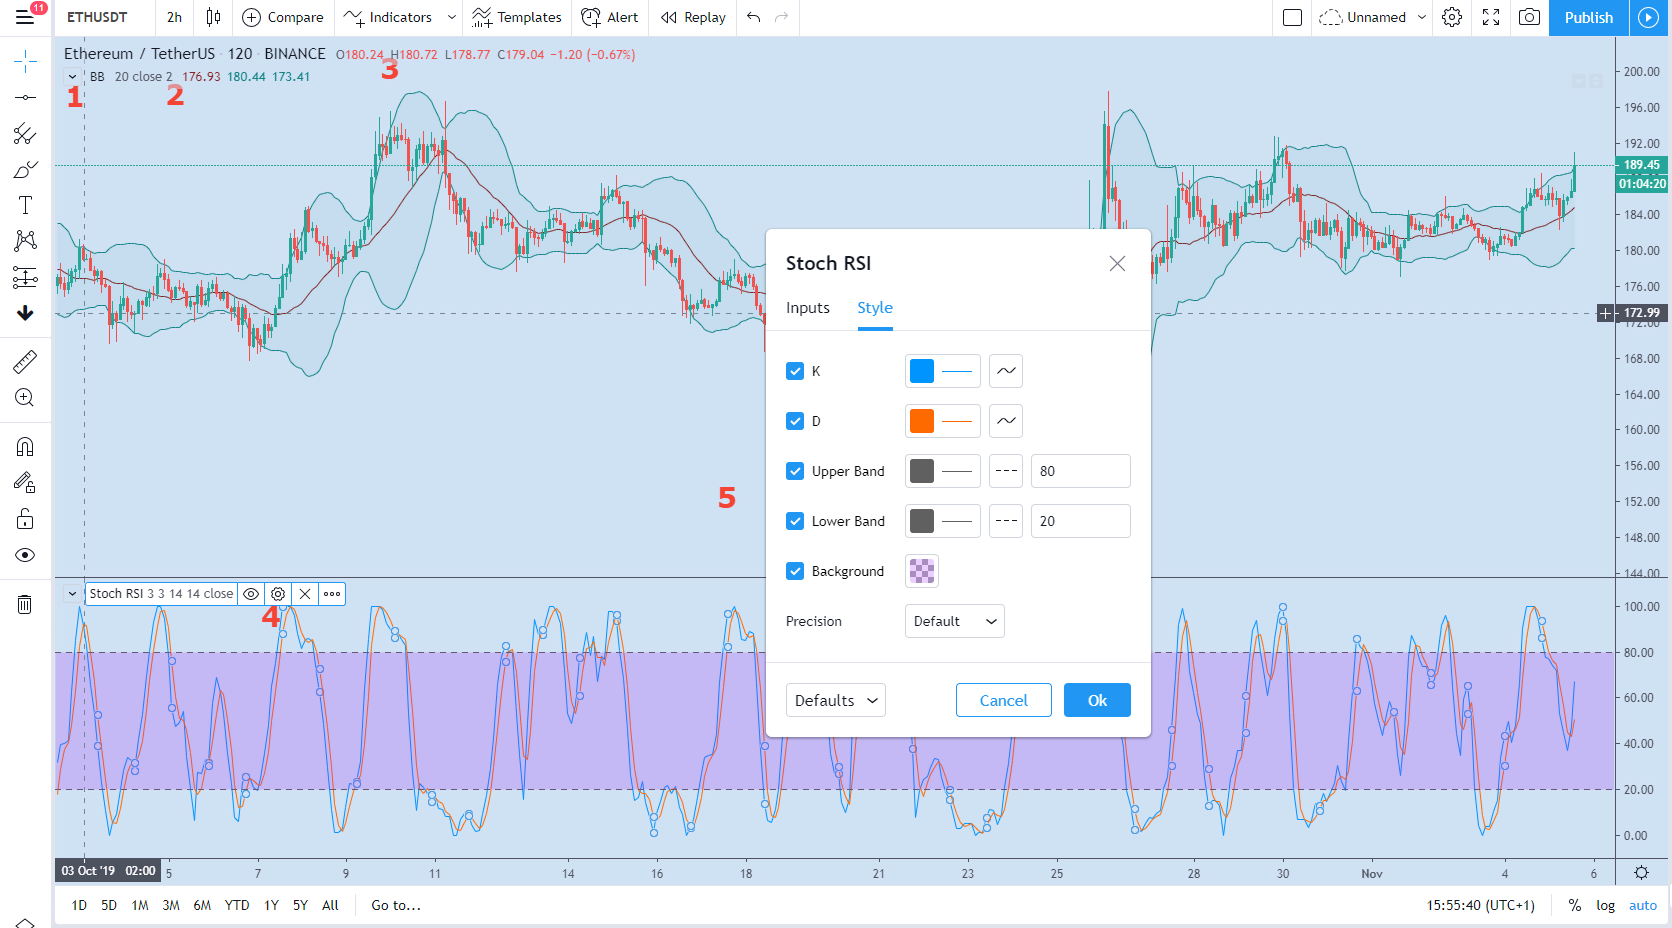
Shows the trading pair and exchange you’ve selected
Shows the candle sizes used in the chart, different candles sizes have a different impact on the Technical Indicators you use.
Add a Technical Indicator to research.
Change the values of the indicator by hovering over the indicator you have selected, these values are most often similar to the values that can be adjusted in Cryptohopper’s Strategy Designer. Now you will be able to discover patterns!
Additionally, you will be able to adjust the colors and thickness (or other values, depending on the indicator) of the indicators shown in the graph.
If you would like to give trading bots a try, click here to get your 7-day free trial!
Happy hopping!


_webp.webp&w=3840&q=75)
_webp.webp&w=3840&q=75)


