.webp&w=3840&q=75)
What is a Bull Chart Pattern in Crypto and How to Identify One
Investors in the crypto market often depend on technical analysis to forecast future price trends. A technical analysis chart pattern called the ‘bull flag pattern’ indicates that an asset’s value is about to increase.
Investors can identify a bull flag pattern and adjust their investment strategy accordingly to make long-term gains. In this article, we explore what a bull chart pattern is, how to find it, and how to trade during a bull chart pattern.
What is a Bull Flag Chart Pattern?
A bull flag chart pattern is a period of either horizontal or downward-sloping consolidation, followed by a significant increase upward.
This chart pattern usually occurs when market prices fluctuate within a small range, before or after rapid jumps or falls. Investors can use the market data to identify entry points for a bull pattern and potentially earn a profit.
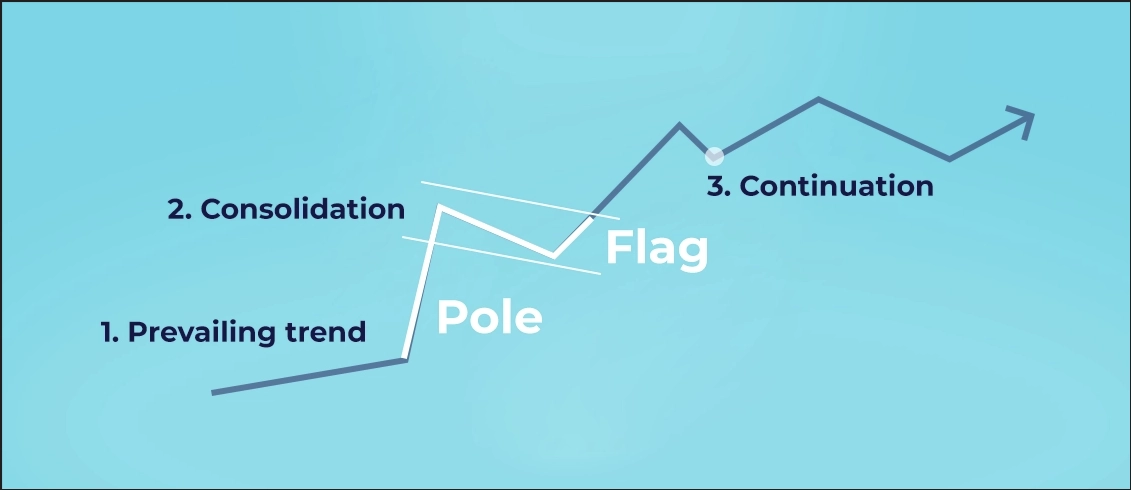
The bull flag chart pattern resembles a parallelogram-shaped flag with poles on either side. Trading strategies like swing trading and the bull flag pattern are helpful for traders in volatile market conditions.
The main goal of finding a bull flag pattern is for investors to profit from the market’s current momentum.
The bull flag chart pattern is a short-term trend and may last anywhere from one to six weeks. If a trader can identify a bull flag chart pattern precisely, he can forecast the upcoming bull trend and leverage it to make profits.
How to Identify a Bull Flag Chart Pattern
The bull flag chart pattern resembles a flag with a pole. It is referred to as the bull flag because it represents an upswing. A bull flag has three main features that can be used to identify the pattern:
The chart forms a pole after a considerable increase in its relative volume.
At a lower volume, the cryptocurrency consolidates near the top of the pole to produce the flag.
At a relatively solid volume, it maintains the trend by breaking out of the consolidation pattern.
A bull flag chart pattern helps identify the points that require correction before the previous bull trend resumes. The presence of previous momentum is necessary for this chart pattern, which is represented by consecutive bullish bars.
After consecutive bullish bars, consolidation helps as a corrective action to adjust the trading strategies.
Price corrections are often represented in multiple ways - pennants, downtrend channels, or sideways movement. The third stage of the bull flag pattern - the break of the flag - offers the optimal entry signal.
In the bullish flag pattern, the previous upswing serves as the initial profit objective, and the consolidation functions as the ‘stop-loss level.’ There are a few steps to identify the bull flag pattern:
Notice the initial upward movement framed with a string of bullish bars. This will hardly have any retracement bars.
Wait for the corrective action. A downtrend channel represents a lower-low structure.
Identify the consolidation and set the breakout level to place the order.
How to Trade the Bull Pattern
In the bull flag chart pattern, when the flag portion fails to maintain its downward momentum after identifying the pole, crypto traders can place the entry.
Traders verify the bull flag signal using the volume indicator.
Traders estimate that the trading volume will decline during the price correction by using the volume indicator on the chart.
The bull trend is likely to continue if the trade volumes decrease and the price breaches the upper threshold of the initial upswing. However, when trading this type of chart pattern, the bull flag’s support line should be below the stop-loss order.
Traders can use the risk-to-reward ratio to determine the take-profit threshold.
Though the bull flag chart pattern helps estimate the continuation of the bull pattern, the trader’s risk-return profile determines the success of any crypto trading strategy. A trader’s investment goals and their execution of trading strategies determine whether they get rewards or losses.
Investors can accurately predict the bull flag chart pattern with signals like rising crypto prices on high relative volume and corrective patterns as they consolidate at near highs to make the most of this chart pattern.
Benefits and Risks of a Bull Chart Pattern
A bull flag chart pattern helps investors identify a transparent price level to place a long trade, as well as an effective stop-loss order.
However, following a bull flag pattern is not a completely risk-free crypto trading strategy. Any trading market involves risk, and in the comparatively volatile crypto markets, the most significant risks are instability and unexpected price swings.
The bull flag pattern is advantageous when accurately spotted. It helps investors gain profits by entering the market at the right time. However, investors should always understand the risk-returns of a particular investment. This way, they can avoid negative results when they trade bullish or bearish patterns.


_webp.webp&w=3840&q=75)
_webp.webp&w=3840&q=75)


