
Technical Analysis 101 | The Best Momentum Indicators
Dive into the best momentum indicators in technical analysis. Understand Stochastics, RSI, StochRSI, and their applications on the Cryptohopper platform.
Traders rely on momentum indicators much like police officers use speed radars on the highway. These indicators help traders identify rapid price movements to profit from, similar to catching speeding drivers to issue tickets.
However, it's important to note that momentum indicators measure the increasing speed of prices in charts, not the speed of your car.
How do they work?
Momentum indicators gauge how fast a cryptocurrency's price is changing by comparing its current price to its price from a specified number of periods ago.
If there's a significant difference between these two prices, it indicates that the price is moving quickly and has strong momentum.
Normally, these indicators assign values between 0 and 100 to analyze the change of price movements.
For example, if the current price has an assigned value of 50, and the next price is 52, followed by 56, it signifies that the price is gaining momentum and trending stronger with each candle, indicating increasing momentum.
As a trader, it's important for you to understand and be aware of some of the most common momentum indicators that professional traders use.
These indicators can help you identify key trading opportunities and make more informed decisions in the market. Let's take a look at some of these essential momentum indicators:
Stochastics
Stochastics is a valuable momentum indicator for traders. Its creator, George C. Lane, described it as an indicator that "follows the speed or the momentum of the price. As a rule, the momentum changes direction before price."
The Stochastics is a useful indicator for identifying overbought and oversold conditions in a cryptocurrency's price. When the indicator falls below 20, it signals that the cryptocurrency is oversold, suggesting a potential buying opportunity.
Conversely, when the indicator rises above 80, it indicates that the cryptocurrency is overbought, signaling a potential selling opportunity. It's important to note that these overbought and oversold levels can be adjusted on Cryptohopper to fit your trading strategy.
Additionally, you have the option to invert these levels on our platform, buying when it's oversold and selling when it's overbought. This inversion transforms the indicator into a trend-following tool rather than a momentum indicator.

How Stochastics are calculated:
Stochastics is a versatile indicator that assesses the closing price of the current candle in relation to its highest and lowest points.
If the closing price is near the highest point of the specified period, the indicator signals that the asset may be overbought, suggesting a potential reversal.
Conversely, if the closing price is near the lowest point, it may indicate an oversold condition and a potential reversal to the upside.
Stochastics also assesses the strength of the current trend by comparing its current level with past levels, helping traders gauge the momentum in the market.
RSI
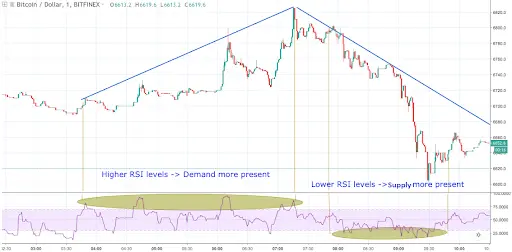
The Relative Strength Index (RSI) and Stochastic, while serving similar functions, employ different calculation methods. RSI assesses recent price changes to determine whether the current price is in an oversold or overbought condition. This information can be useful for you in assessing potential price reversals and making informed trading decisions.
The Relative Strength Index (RSI) also uses a range from 0 to 100 to determine oversold and overbought conditions, but it employs different threshold values: typically 70 and 30.
When the RSI surpasses the 70 line, it indicates that the price is in an overbought state, signaling a potential sell opportunity. Conversely, when it falls below 30, it signifies an oversold condition, offering a potential buy signal.
It's worth noting that you can adjust these RSI values on Cryptohopper to align with your trading preferences, and even reverse the buy and sell signals if needed. This flexibility allows you to tailor your trading strategy to your specific goals.

Stochastic RSI
Stochastic RSI (StochRSI) is a composite indicator that combines elements of both the Stochastic and RSI indicators. Instead of applying the Stochastic formula to price data, it uses the Stochastic formula on RSI values.
This modification allows traders to gain insights into the momentum of RSI itself, providing a different perspective on market conditions.
The Stochastic RSI (StochRSI) operates within a range of 0 to 100. When its values fall below 20, it's seen as indicating oversold conditions, while values exceeding 80 suggest overbought conditions.
StochRSI operates in a manner similar to the two indicators explained earlier. Its purpose is to increase sensitivity and produce more signals compared to using these two indicators separately. This can be valuable for traders seeking additional insights into market conditions.
The overbought and oversold levels for these indicators are not one-size-fits-all. Different cryptocurrencies may exhibit varying behaviors in relation to these levels. To optimize your strategy, consider fine-tuning these thresholds based on the specific cryptocurrencies you are trading.
This customization can help ensure that the indicators align more accurately with each asset's price movements.

Choose your timeframe wisely
In the cryptocurrency market, momentum indicators are often most effective when used on shorter timeframes, such as 1-hour or even shorter.
This is because shorter timeframes tend to have more price noise and higher volatility, offering you opportunities for profitable trades. On longer timeframes, trends are more pronounced, making trend-following indicators a better choice.
It's essential to match your trading strategy and indicators with the timeframe that aligns with your goals and risk tolerance.
How to configure these indicators in Cryptohopper
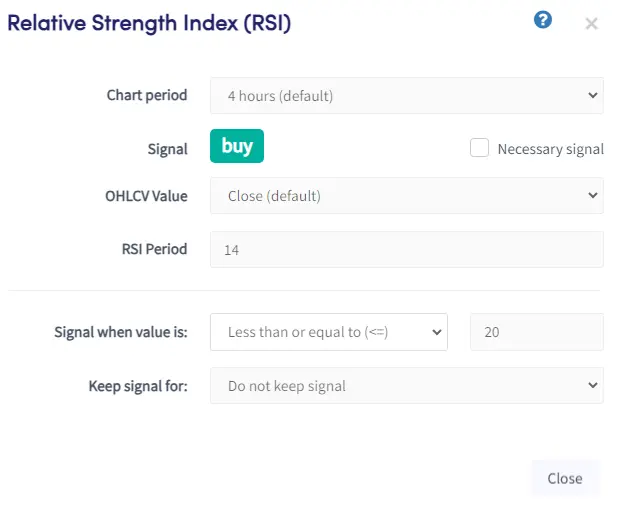
The momentum indicators on Cryptohopper are quite similar to the RSI, as shown in the image below. For a more comprehensive guide on using our strategy designer, please refer to our documentation.
To configure the indicator, you'll start with the "Chart Period." As mentioned earlier, momentum indicators tend to work best on shorter timeframes like the 1-hour chart or even lower.
However, it's essential to backtest and ensure it suits the specific cryptocurrency you plan to trade.
Next, you'll find the "Signal" option, which you can set as "Buy" or "Sell." It's straightforward: configuring it as "Buy" will trigger buy signals, while "Sell" will generate sell signals.
If you want to use the indicator for both buy and sell signals, such as buying when it's oversold and selling when it's overbought, add it twice to your strategy—once for buy and once for sell.
Moving on to "OHLCV Value," it defaults to "Close," and we recommend keeping it as such. Most traders use the "Close" value in technical analysis, aligning your trading approach with other professional traders who rely on technical analysis.
Now, let's discuss "Periods." Exercise caution here, as the period setting can significantly impact the indicator's behavior. You'll need to thoroughly test different period values on the specific cryptocurrency you intend to trade, as the optimal values can vary widely.
Finally, the "Signal when value is" parameter offers flexibility.
Unless you select "equal to," the indicator will generate sticking signals. Sticking signals mean that as long as a certain condition is met, it will keep sending buy or sell signals based on your configuration.
For example, if you set the RSI to send a buy signal as long as its value is less than or equal to 20, it will continue to do so. This feature is valuable for using indicators as filters in your strategy.
For instance, you can create a strategy that triggers a buy signal when the 1-hour chart RSI is oversold and simultaneously observes a bullish EMA crossover on the 15-minute chart. This way, you ensure that you buy when the price is low, but the cryptocurrency is initiating an uptrend.
Remember to adjust the indicator values based on the specific cryptocurrency you're trading.
Bottom line
In essence, momentum indicators don't track trends or volume but are excellent at gauging the speed and strength of price movements. When combined with other indicator types, particularly trend-following indicators, they can provide robust trading signals.
Cryptohopper offers a variety of momentum indicators in addition to those mentioned earlier. You can also utilize Momentum, Chaikin oscillator, CCI, MFI, ROC, Ultimate oscillator, and Williams %R to enhance your trading strategies.


_webp.webp&w=3840&q=75)
_webp.webp&w=3840&q=75)


