
Our journey so far:
SMA vs EMA for trend direction
MACD for momentum shifts
RSI for overbought/oversold zones
Bollinger Bands for volatility and price extremes
Stochastic Oscillator for timing reversals
VWAP for fair price detection
Volume + OBV for spotting smart money flow
ATR for volatility-based risk management
Fibonacci Retracements for market pullbacks
Today, we’re diving into Stochastic RSI, the hybrid oscillator that combines the best of RSI momentum analysis with Stochastic timing precision.
The Evolution of Momentum Analysis
Technical analysts have long sought the perfect momentum indicator. Relative Strength Index (RSI), introduced by J. Welles Wilder in 1978, became the gold standard for identifying overbought and oversold conditions. Yet traders noticed a limitation: during strong trends, RSI could hover in neutral territory for extended periods, providing little actionable information.
The Stochastic Oscillator, developed earlier by George Lane, offered different insights by measuring where price sat within its recent range. It was more sensitive than RSI but could generate excessive signals in choppy markets.
In the 1990s, Tushar Chande and Stanley Kroll combined the best aspects of both the Stochastic Oscillator and Relative Strength Index. The result was Stochastic RSI – an indicator that applies the Stochastic formula to RSI values rather than price.
Instead of asking “where is price relative to its range?” (Stochastic) or “how strong is momentum?” (RSI), StochRSI asks: “where is the momentum reading itself relative to its own recent extremes?” This ultra sensitive indicator reveals subtle shifts in market dynamics.
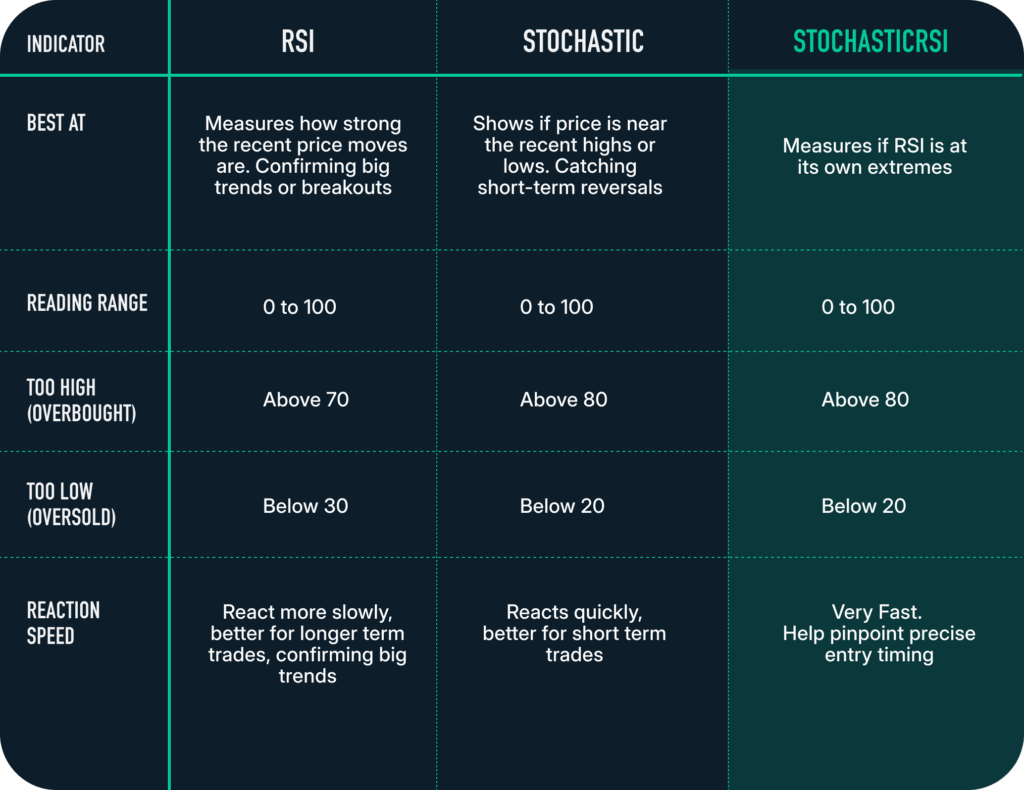
How to Interpret It
The Dual-Line System:
StochRSI displays two lines, similar to the Stochastic Oscillator:
%K Line (fast line): The main StochRSI calculation – more reactive to momentum changes
%D Line (signal line): A moving average of %K – provides smoothed confirmation
Critical Zones:
Overbought (>80): Market momentum stretched too high. Reversal or consolidation may follow.
Oversold (<20): Market momentum stretched too low. Bounce may follow.
Crossovers: When the fast StochRSI line crosses the signal line in these zones, it often precedes sharp moves.
Midline (50): Momentum balance point. Trading above suggests bullish pressure, below suggests bearish.
Why StochRSI Matters for Trading
Enhanced Sensitivity: Traditional RSI might stay in neutral territory (30-70) during trending markets, providing few signals. StochRSI generates more frequent overbought/oversold readings, giving traders more opportunities.
Early Warning System: StochRSI can signal potential reversals before they become obvious on price charts or standard RSI, providing a timing advantage.
Trend Confirmation: The dual-line system (%K and %D) provides confirmation through crossovers, reducing false signals compared to single-line oscillators.
Example in Action
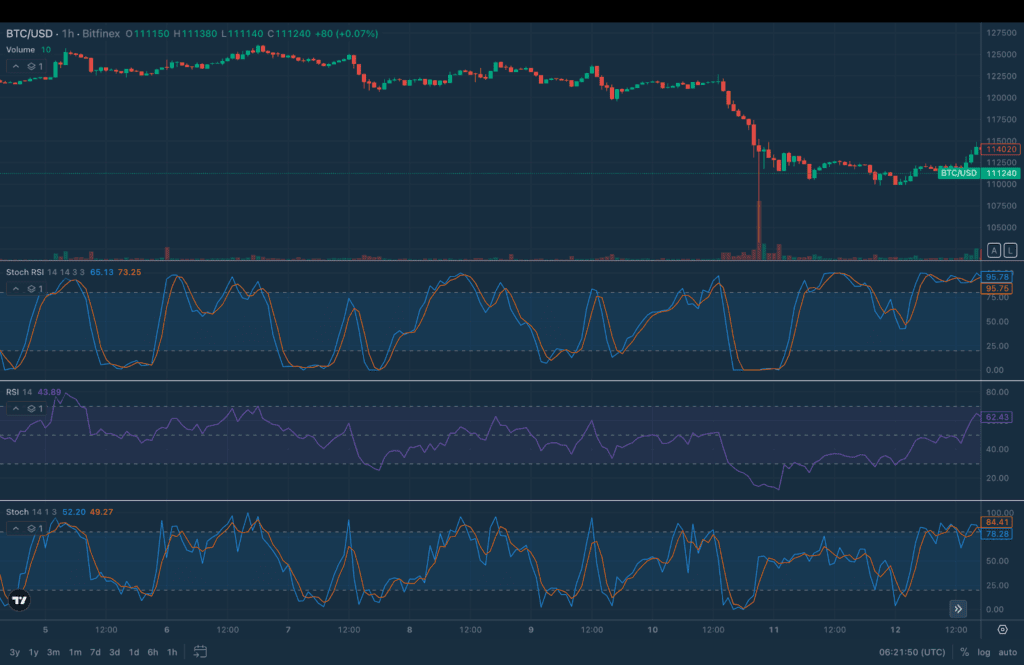
As of Oct 12:
Price: $111,240
Stoch RSI: 85.19 %K, 73.25 %D (overbought)
RSI: 43.89 (neutral to slightly bearish)
Stochastic: 62.20 %K, 49.27 %D (neutral)
What each indicator revealed:
RSI (purple line, third panel): Throughout the entire period between Oct 5-12, RSI remained mostly in neutral territory with a few exceptions on Oct 5 where RSI hit overbought and BTC’s sharp drop on Oct 10, where RSI dipped to oversold. Traders watching only RSI would have minimal actionable signals during the other significant price movements during this period.
Stochastic (blue/orange, bottom panel): Generated several oversold and overbought cycles throughout the period. More responsive than RSI, showing clear extremes during the major drop around Oct 11 and subsequent recovery.
StochRSI (blue/orange, second panel): The most active of all three indicators, oscillating dramatically between 0-100 multiple times. Notice how StochRSI reaches much deeper into extreme zones than regular Stochastic, providing earlier and more pronounced signals:
Oct 5-6: StochRSI hit overbought (80+) preceding a pullback of $3000 in price
Oct 7: Dropped to oversold (below 20) preceding a bounce of over $2000 in price.
Oct 8-9: Reached overbought a few times again, each time precedes a pull back of around $1000 each.
Oct 10 (the crash): Plunged to extreme oversold (near 0) as BTC dropped 18%.
Oct 12: Surged to overbought (85+) as BTC recovers
Key moment (Oct 12):
BTC recovering from sharp drop, hovering at $111,240
RSI at 43.89 (neutral, showing weak momentum despite recovery)
Stochastic at 62.20 (neutral, moving toward overbought)
StochRSI at 85.19 (overbought with %K well above %D at 73.25) This current setup shows StochRSI in overbought territory with the %K line significantly above the %D line, suggesting the recent bounce may be losing steam.
Traders who bought immediately when StochRSI first hit oversold on Oct 10 would have faced significant pressure. The indicator stayed in oversold territory for an extended period as BTC continued crashing from ~$122,000 down to ~$103,500. This highlights a crucial lesson: during major macro events (news, policy changes, etc), technical indicators can remain at extremes far longer than expected. A perfectly timed StochRSI signal means nothing if you’re fighting against a major macro catalyst.
Advanced StochRSI Strategies
1. Multi-Timeframe Trend Alignment
Advanced StochRSI Strategy: Multi-Timeframe Trend Alignment
Use higher timeframes to define the trend and lower timeframes to fine-tune your entries.
Step 1: On the daily chart, identify the overall market direction — uptrend, downtrend, or sideways.
Step 2: On the 4-hour chart, look for StochRSI signals that align with that trend.
Trading tip: In an uptrend, only consider oversold signals (below 20).
In a downtrend, only consider overbought signals (above 80).
This simple alignment filter helps you avoid counter-trend trades and improve your win rate compared to trading every signal blindly.
2. Confluence With Other Indicators
StochRSI + RSI: RSI confirms the broader trend while StochRSI pinpoints exact entry timing. Only trade when both indicators align. For example, when StochRSI crosses upward from 18 and RSI is simultaneously rising from 35, you have double confirmation.
StochRSI + Volume: Reversal signals accompanied by volume expansion indicate institutional participation. For instance, if StochRSI crosses upward from 12 as volume surges, it suggests a high-probability long entry supported by strong buying pressure.
StochRSI + Support/Resistance: The highest-probability setups occur when StochRSI signals align with key price levels. If BTC bounces from a $120,000 support zone while StochRSI dips to 12, that confluence of price level and momentum exhaustion creates an ideal long entry point.
Fibonacci Levels + StochRSI: Fibonacci retracements offer another layer of confirmation. Traders often draw them on recent swings and observe how StochRSI behaves near key levels like 38.2%, 50%, or 61.8%. When price approaches a Fibonacci level and StochRSI reaches an extreme reading (below 20 or above 80) with a crossover forming, that overlap can create particularly compelling technical setups.
3. Divergence Trading
Bullish Divergence:
When the price makes a lower low but StochRSI makes a higher low, this signals that downward momentum is weakening even though the price is still falling. This suggests the selling pressure is exhausted and a reversal may be coming. Consider a long entry when StochRSI crosses upward from the oversold zone.
Example: Bitcoin drops to $110,000, then falls further to $108,000 (lower low in price). However, StochRSI reads 15 at the first drop, then rises to 25 at the second drop (higher low in momentum). This bullish divergence (lower price but stronger momentum) often signals an upcoming upward reversal.
Bearish Divergence:
When the price makes a higher high but StochRSI makes a lower high, this signals that upward momentum is weakening even though the price is still rising. This suggests the buying pressure is exhausted and a reversal may be coming. Consider a short entry when StochRSI crosses downward from the overbought zone.
Example: Ethereum peaks at $4,500, then rallies to $4,550 (higher high in price). However, StochRSI peaks at 92 at the first top, then only reaches 78 at the second top (lower high in momentum). This bearish divergence (higher price but weaker momentum) often precedes downward reversals.
Bonus Read: StochRSI + Bollinger Bands in Action
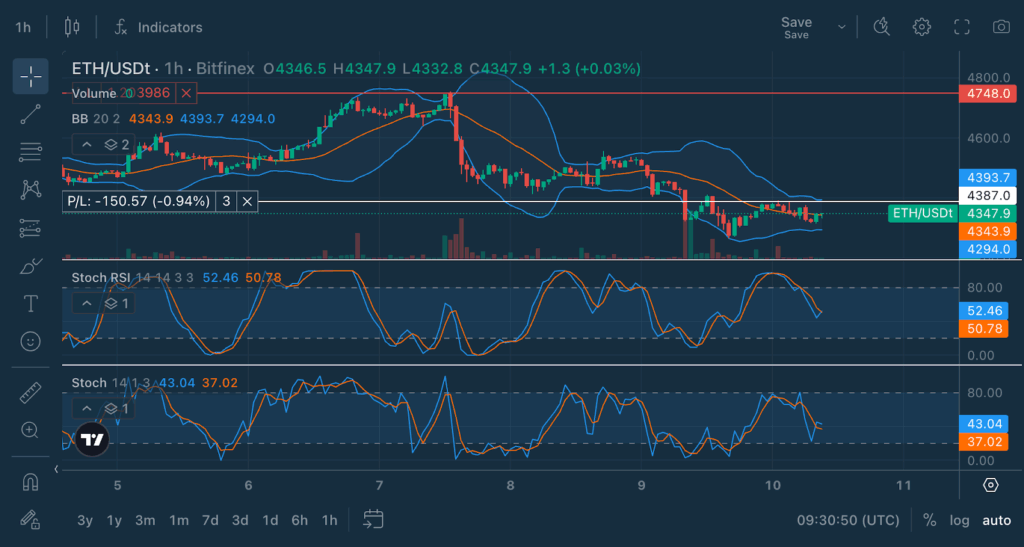
Looking at this ETH/USD chart on the 1-hour timeframe, we can see the powerful combination of StochRSI with Bollinger Bands and volume analysis.
Current readings (Oct 10):
Price: $4,347.9
Bollinger Bands: Price consolidating near middle band ($4,343.9)
StochRSI: 52.46/%K, 50.78/%D (neutral zone)
Stochastic: 43.04/%K, 37.02/%D (neutral)
Volume: Declining after recent spikes
Lower Bollinger Band Touch (Oct 7): ETH touched the lower Bollinger Band around $4,280, indicating price reached a volatility extreme. Simultaneously, both StochRSI and regular Stochastic dropped into oversold territory (below 20). This confluence created a high-probability long entry. Notice the volume spike that accompanied the bounce – this confirmed institutional buying interest at the extreme. ETH subsequently rallied over $100 in the following hours.
Upper Bollinger Band Rejection (Oct 8-9): Price extended to the upper Bollinger Band near $4,580 while StochRSI reached extreme overbought levels (above 80). The combination of volatility extreme and momentum exhaustion signalled potential reversal. The subsequent pullback validated this signal, with ETH declining back toward the middle band.
Middle Band Support (Oct 10): After the decline, ETH found support at the middle Bollinger Band. StochRSI hit oversold levels around 20, suggesting momentum exhaustion to the downside.
The Bollinger Bands are contracting (notice the narrowing distance between upper and lower bands), which typically precedes a volatility expansion and directional move. The next high-probability trade setup will occur when:
Price touches either the upper or lower Bollinger Band (volatility extreme)
StochRSI reaches extreme territory (<20 or >80)
Volume expands significantly (20%+ above recent average)
Common Mistakes to Avoid
Overtrading Every Signal
StochRSI generates frequent signals. Some are false alarms. Only trade signals with multiple confirming factors (support/resistance, volume, trend alignment).
Fighting the Trend
Taking overbought signals in strong uptrends or oversold signals in strong downtrends leads to repeated losses. Also, StochRSI can remain overbought for days during powerful uptrends or oversold during downtrends. Always identify the prevailing trend first. Use StochRSI for entry timing within trends (buying dips in uptrends, selling rallies in downtrends) rather than counter-trend reversals.
Using Low Timeframes
1-minute and 5-minute charts contain excessive noise. Consider using a minimum 15-minute for day trading, 4-hour for swing trading. Higher timeframes produce fewer but significantly more reliable signals.
Ignoring Context
Entering positions immediately upon crossover without checking support/resistance, volume, or news events dramatically increases risk. Consider using a pre-trade checklist verifying trend direction, price structure, volume confirmation, and event schedule.
Dismissing Volume
StochRSI signals with weak volume often fail. Signals with volume spikes indicate institutional involvement and genuine conviction.
Try StochRSI on Bitfinex
Log in to Bitfinex and select your pair.
Go to Indicators, search StochRSI.
Watch for crossovers in the overbought/oversold zones.
The post appeared first on Bitfinex blog.


