
There is no right or wrong when you trade. You have to figure out what works best for you. In this new article series, I am going to share some of the tools and techniques that you can use to make qualified trading decisions.
What to look for in a chart
Some traders might only look at the candles and watch the price action, while others add indicators or look at the liquidity in the order book and depth chart, etc. There are many approaches to technical analysis.
In my experience, I have found that looking at the higher time frames gives the clearest signal and is also the most accurate when figuring out where the markets are going.
My approach would firstly be to get a good overview of where the market is heading. Are we in a bear or a bull market? I do this by looking at the higher time frames. Personally, I use four hours, daily, sometimes even weekly candles. By looking at these higher time frames, you will be able to get a sense of the general direction.
Moving average
Using indicators can help you confirm the market direction. The most common indicator for doing so is probably the moving average indicator. A moving average is the average price of a given period of time. The most commonly used moving average is the 200 daily moving average (200D MA). It takes the average price over the last 200 days. When the price is above the 200D MA, we are in a bull market. When it’s below, we are in a bear market.
Golden Cross and Death Cross Others add a 50D MA, which is more sensitive to price movement. When the 50D MA crosses the 200D MA from below, you call it a “golden cross”, which indicates the end of the bear market and the start of a bull market. If the 50D crosses the 200D MA from above to below, this is a “death cross”, which is regarded as a bearish signal.
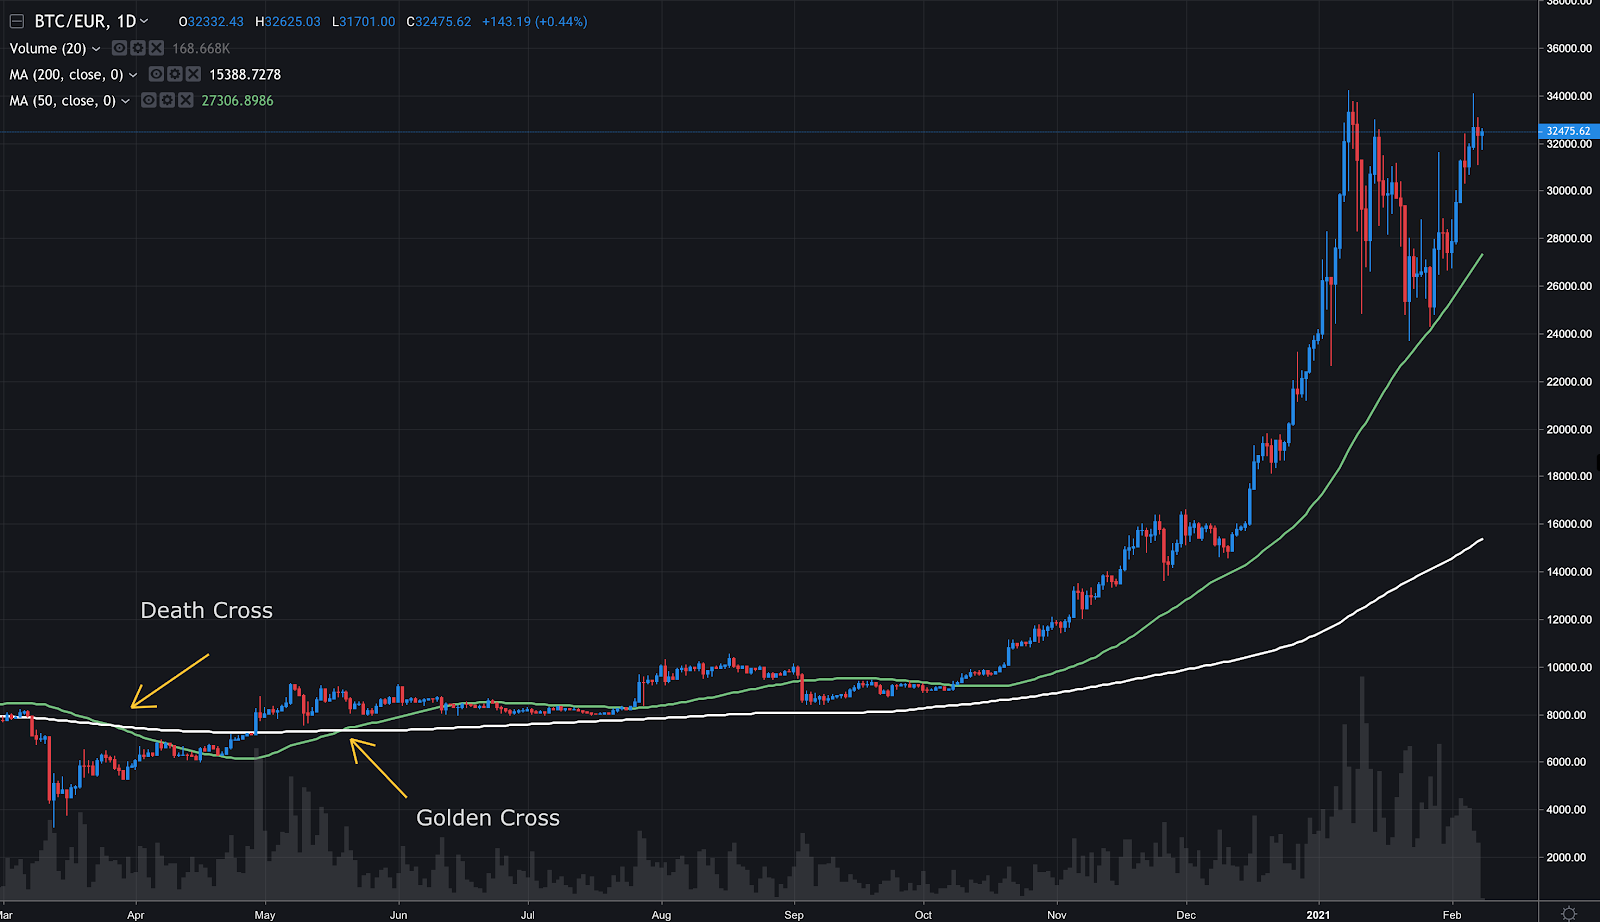
We are currently in a bull market as the price crossed the 200D MA in April, followed by a golden cross in the middle of May. Since then the price has stayed above the 200D MA, leading to a dramatic price surge at the end of the year 2020.
Moving averages are lagging indicators
Moving averages fall into the category of “lagging indicators”. These are called lagging indicators simply because they are lagging behind the price action and are thereby slow to adapt to new market conditions.
In the example above, the big drop in March gives a death cross signal at the end of March. However, at that point, the price has already recovered significantly at the time of the crossover. The golden cross appears one and a half months later, and at this point in time, the price has been above the 200D MA for quite some time.
Moving averages as support and resistance
The moving averages can also be seen as support and resistance levels. During the bull run of 2016-17, the 20W MA was working as support. Every time Bitcoin experienced a pullback, it was going back to the 20W MA before bouncing off and then continuing higher.
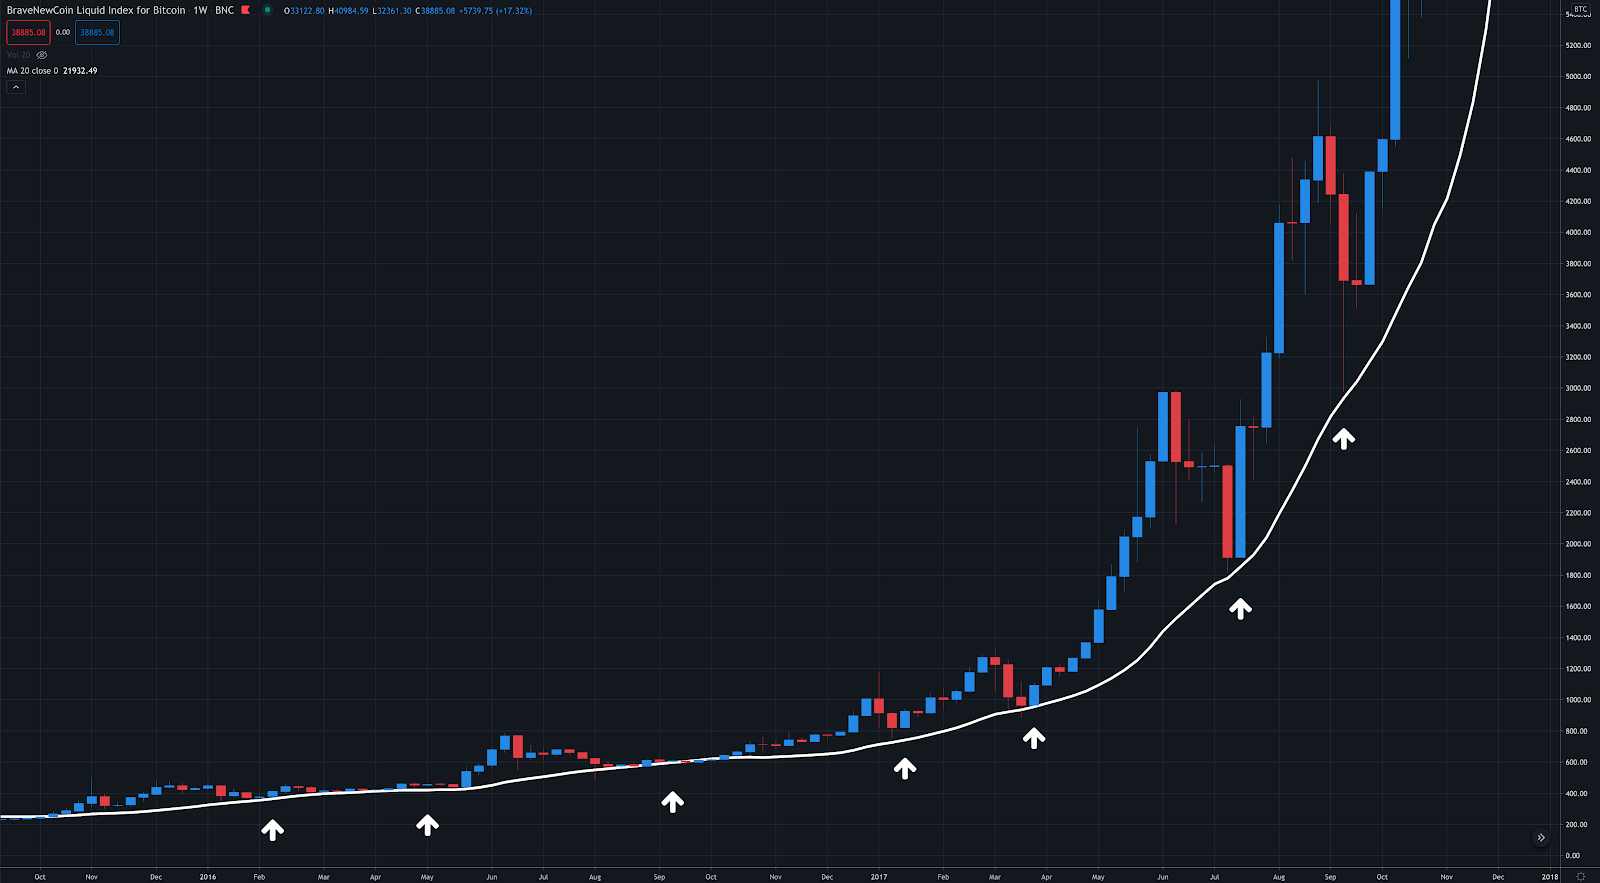
Pullbacks are a healthy part of a bull market like the one we saw in 2017. The market was moving up and then experienced a pullback to the 20W MA but then bounced off and continued higher. The longer between pullbacks, the sharper the movement that can be expected. Eventually, support burst after a blow-off top that led into a bear market.
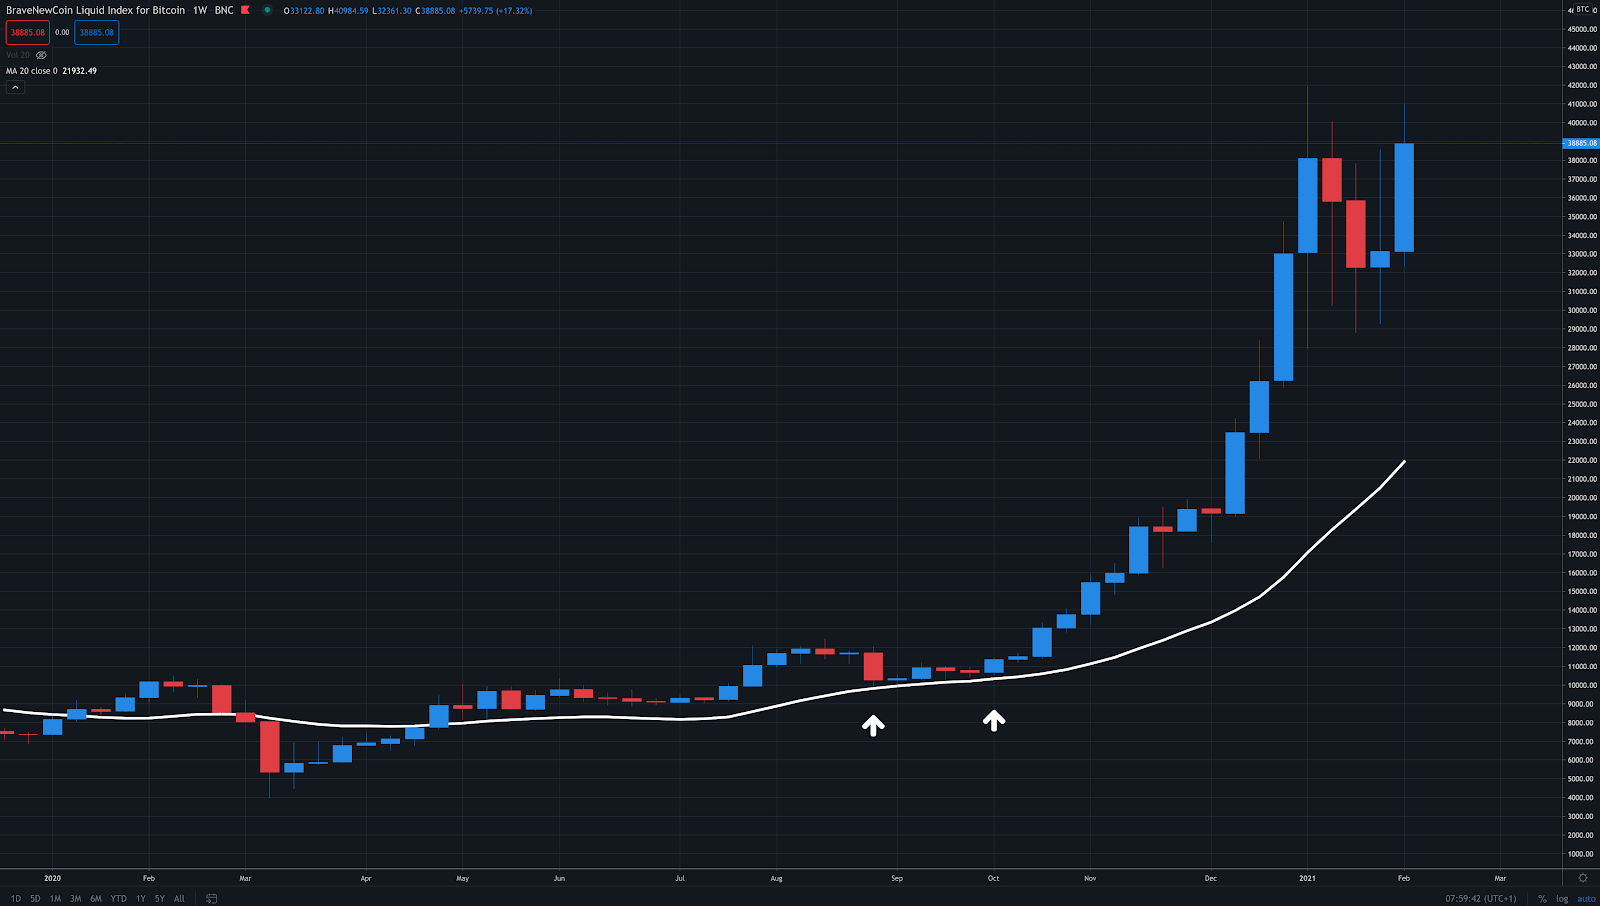
Since the dramatic drop in March due to Covid-19, Bitcoin has recovered and is currently in a bull market with hefty price increases and again, we see the 20W MA providing support. It will be very exciting to see if it will hold as support the next time we retest.
Moving averages are quite straight forward and as you can see, they can provide you with a lot of information to use when you are deciding on whether to enter or exit the markets.
Start trading on Bitpanda Pro now
This blog post was written by Mads Roland. You can follow him on tradingview.com and Twitter .


