.webp&w=1920&q=75)
A colorful enigma in the world of cryptocurrency, the Bitcoin Rainbow Chart is hailed as an essential guide for investors and traders. With its vivid and distinct color bands, it acts as a strong visual aide, reflecting the long-term trends of Bitcoin's price. But what exactly is this chart, and how can it help you navigate the cryptocurrency market? Let's dive into the details!
The Essence of the Bitcoin Rainbow Chart
The Bitcoin Rainbow Chart, renowned as a tool for predicting the Bitcoin price trajectory, employs a color-coded spectrum. These colors, ranging from dark red to dark blue, illustrate various price ranges, offering a clear insight into Bitcoin's current price relative to past trends.
The Structure:
Comprised of seven color bands, the chart provides:
- Dark Red: The highest price range
- Dark Blue: The lowest price range
You can capitalize on this visual tool to pinpoint potential opportunities for buying or selling, based on Bitcoin's price positioning within these bands.
Accuracy: Can You Rely on the Bitcoin Rainbow Chart?
Though popular and visually appealing, the Bitcoin Rainbow Chart has its limitations:
- Historical Data Dependency: The chart's validity is tethered to historical data and the creators' assumptions.
- Invalidate: The original Bitcoin Rainbow Chart has been invalidated, and while the current version has so far been very accurate, there may come a day when it will be invalidated as well.
- Lack of External Considerations: Regulatory changes, global macroeconomic events, and market conditions are not factored in.
In essence, while it's a valuable asset in visualizing price trends, the chart's accuracy in predicting future prices is not assured.
Usage Guide: How to Benefit from the Bitcoin Rainbow Chart
As an investor, the Bitcoin Rainbow Chart can be a visual boon, simplifying the complexity of Bitcoin's price movements over time. However, the importance of combining this chart with macroeconomic conditions and other technical analysis tools cannot be overstated:
- Utilize as a Reference, Not an Absolute: The chart should supplement, not replace, comprehensive investment strategies.
- Consider Broader Market Conditions: Always evaluate external factors that might influence Bitcoin's price.
Exploring Other Crypto Rainbow Charts
Not confined to Bitcoin alone, the Ethereum Rainbow Chart applies the same visual philosophy, albeit the data starts from 2015, the year Ethereum entered the market.
The Origins of the Bitcoin Rainbow Chart
The origins of the Bitcoin Rainbow Chart can be traced back to 2014, in the middle of its most brutal period during the Mt. Gox implosion. Prices were dropping, and a brutal bear market started that would last until the end of 2016.
Just a few months prior, the "HODL!" meme had been formed. Despite the price action, people on Bitcointalk (the biggest Bitcoin Forum) and the /r/Bitcoin Subreddit were still optimistic about the outlook of Bitcoin. The main sentiment at the time was to focus on Bitcoin's potential to change the world, not on its price.
But even if people were "in it for the technology," falling prices took a toll on morale. That’s when Reddit user and the original inventor, ‘azop’, started posting images of his rainbow charts in the /r/Bitcoin subreddit.
The chart shows the Bitcoin price on a log scale with the famous rainbow color bands. The legend only showed "Sell," "Average," and "Buy."
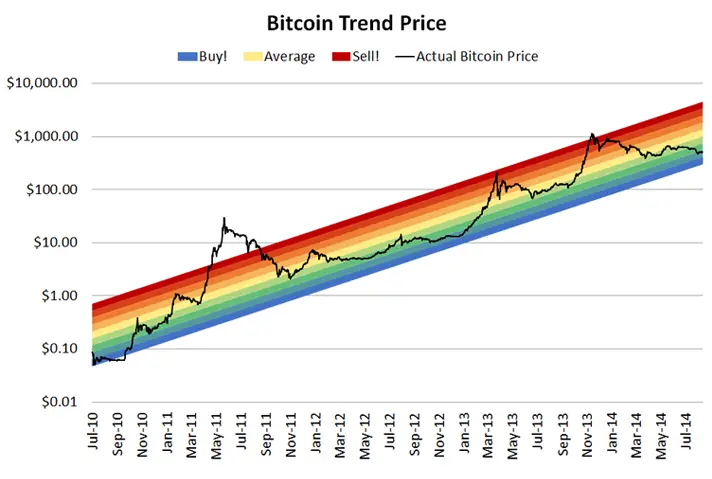
The log chart that he used smoothed out the volatility of Bitcoin and made it possible to see the bigger picture and understand Bitcoin's overall uptrend.
The color bands were a fun and easy way to determine if the Bitcoin price was "undervalued" (indicating a good opportunity to buy) or "overvalued" (indicating a good opportunity to sell).
The rainbow charts that he posted were a big success in the community. They improved morale, and even though most people knew that you can't perfectly predict the price of Bitcoin, they saw it as a good way to gauge the overall market direction.
The rainbow chart gave people hope during times of depressing price action (despite significant Bitcoin adoption progress).
Over the next few months, Azop continued to post his Bitcoin Rainbow chart from time to time in the form of an image in the "Daily discussions" on /r/Bitcoin. He titled it "Azop stability and trend-line/rainbow charts for today."
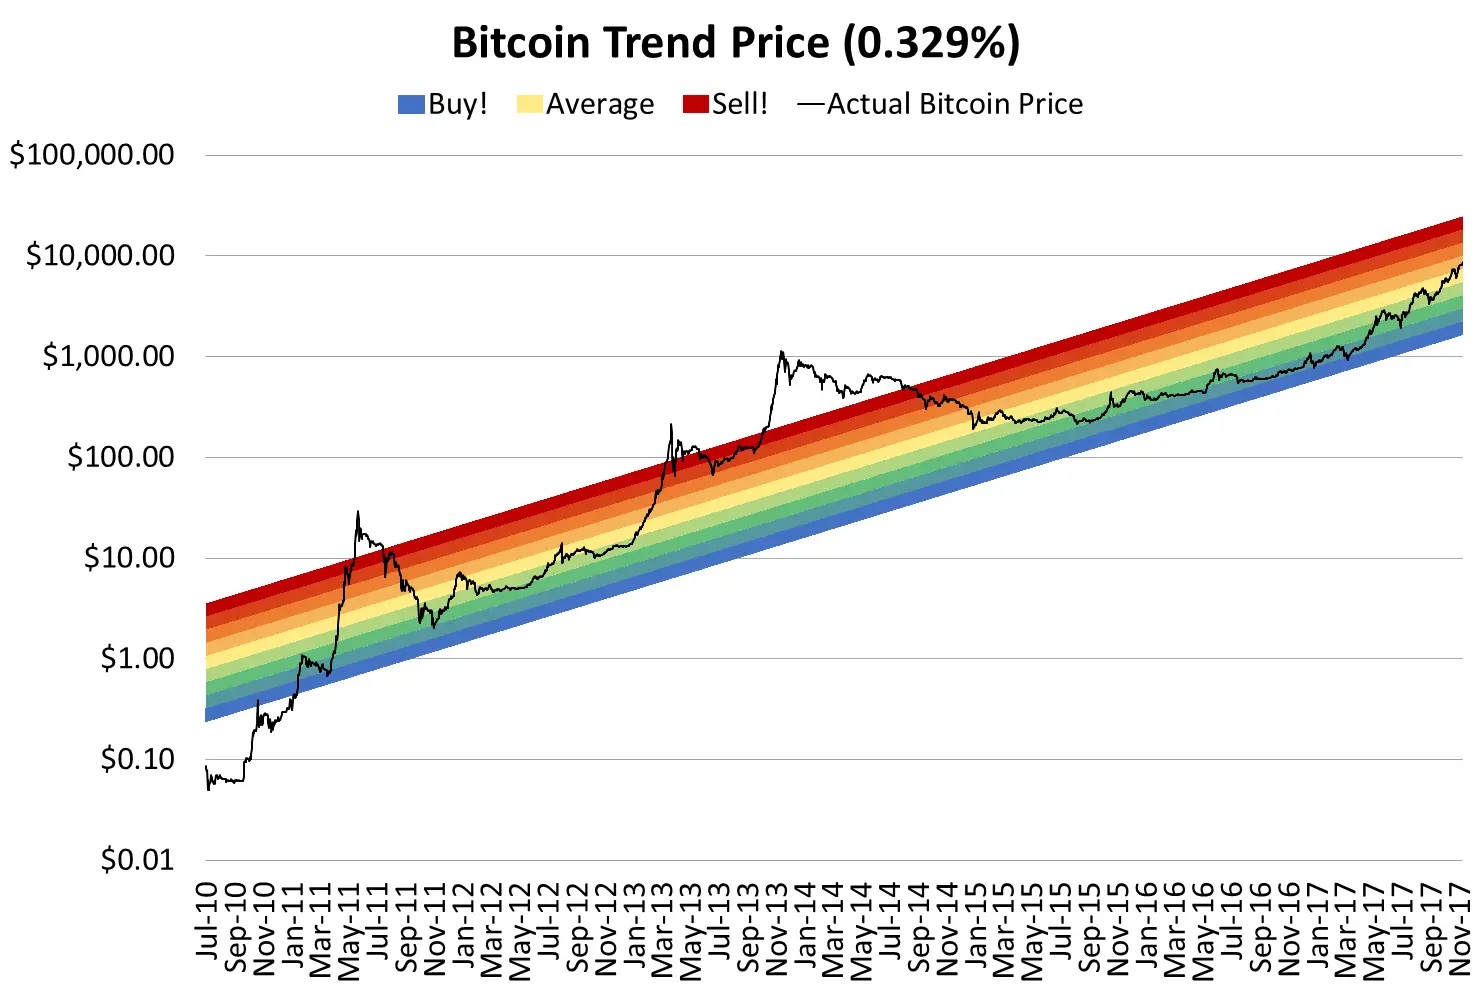
Around two weeks before the bull run in 2017 ended, he stopped posting on Reddit. This is the last known Rainbow chart from that era. As you can see, he tweaked it multiple times to account for new data and eventually had to add the $100,000 mark.
In 2019, Rohmeo continued the legacy by creating an always up-to-date online version of the chart.
However, the Azop rainbow was a straight line, and on a log scale, that means exponential growth. But as you know, exponential growth can’t go on forever, which means the rainbow was destined to end at some point. Nevertheless, he posted the first live version of the Bitcoin Rainbow Chart on 2019-05-19 on Reddit (as a straight line), and it became an instant hit with those who remembered.
But the lack of a “bow” was a problem. However, he was inspired by another chart from the bear market in 2014 from Bitcoin Talk user trolololo. Trolololo used a more moderate and also more scientific way to model the Bitcoin price. He used a logarithmic regression, which means it would flatten out over time (at least on the logarithmic scale).
So Rohmeo created a new curved Rainbow chart that was more realistic and fit better with the updated data.
Newest Rainbow Chart
The Rainbow Chart created by Rohmeo sadly came to an end as it was invalidated. It didn't even come close to reaching maximum bubble territory in 2021, and even worse, during the bear market of 2022, the price fell well below the lowest level of the graph.
Therefore, he realized that the old formula for the Rainbow Chart was too optimistic.
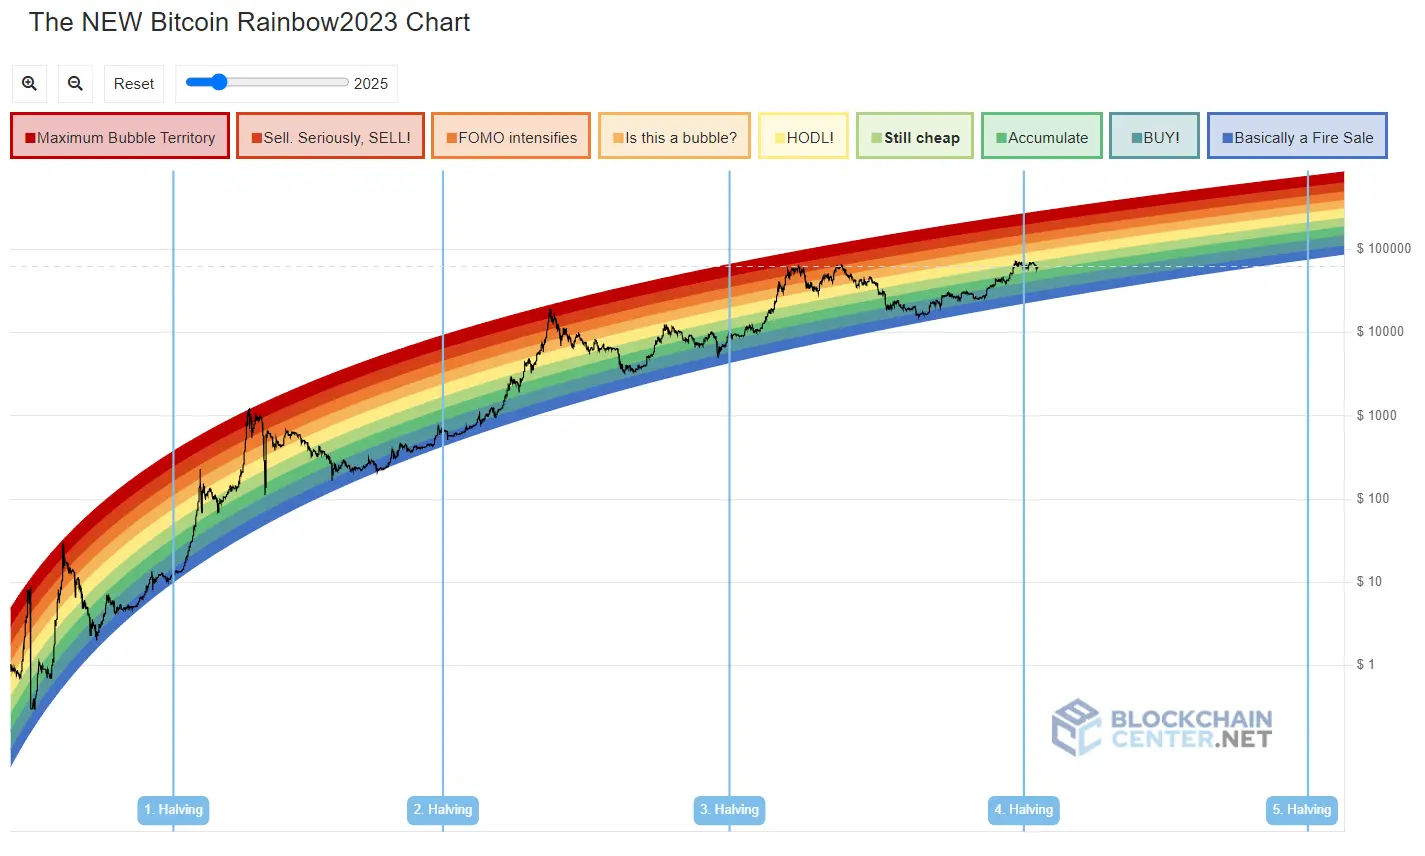
The old formula dated back to 2014, but with 9 more years of data, he realized he could create a new, better curve. So on November 21, 2022, the V2 Version of the Bitcoin Rainbow Chart was published. It consisted of a new formula but retained the same colors.
As of now, the Rainbow Chart V2 has been holding up well; however, the day will probably come when it will be invalidated again and will therefore need to be readjusted.
The Bottom Line
In the ever-fluctuating world of cryptocurrency, the Bitcoin Rainbow Chart stands as a popular and intriguing tool. While it provides a unique perspective on potential buying or selling opportunities, an investor must acknowledge its limitations. You should not rely solely on this chart as it is an oversimplification of the complex nature of cryptocurrency trading.
Understanding its structure and proper application, paired with comprehensive research, you can leverage the Bitcoin Rainbow Chart as an effective instrument in one's trading arsenal. But let it be a colorful guide on the journey, not the destination.


_webp.webp&w=1920&q=75)
_webp.webp&w=1920&q=75)