Polygon (MATIC) Faces 25% Price Collapse, Fears of New Yearly Low Emerge
The price of Polygon (MATIC) has experienced a significant 22% collapse since its July highs, raising concerns about the possibility of a new yearly low.
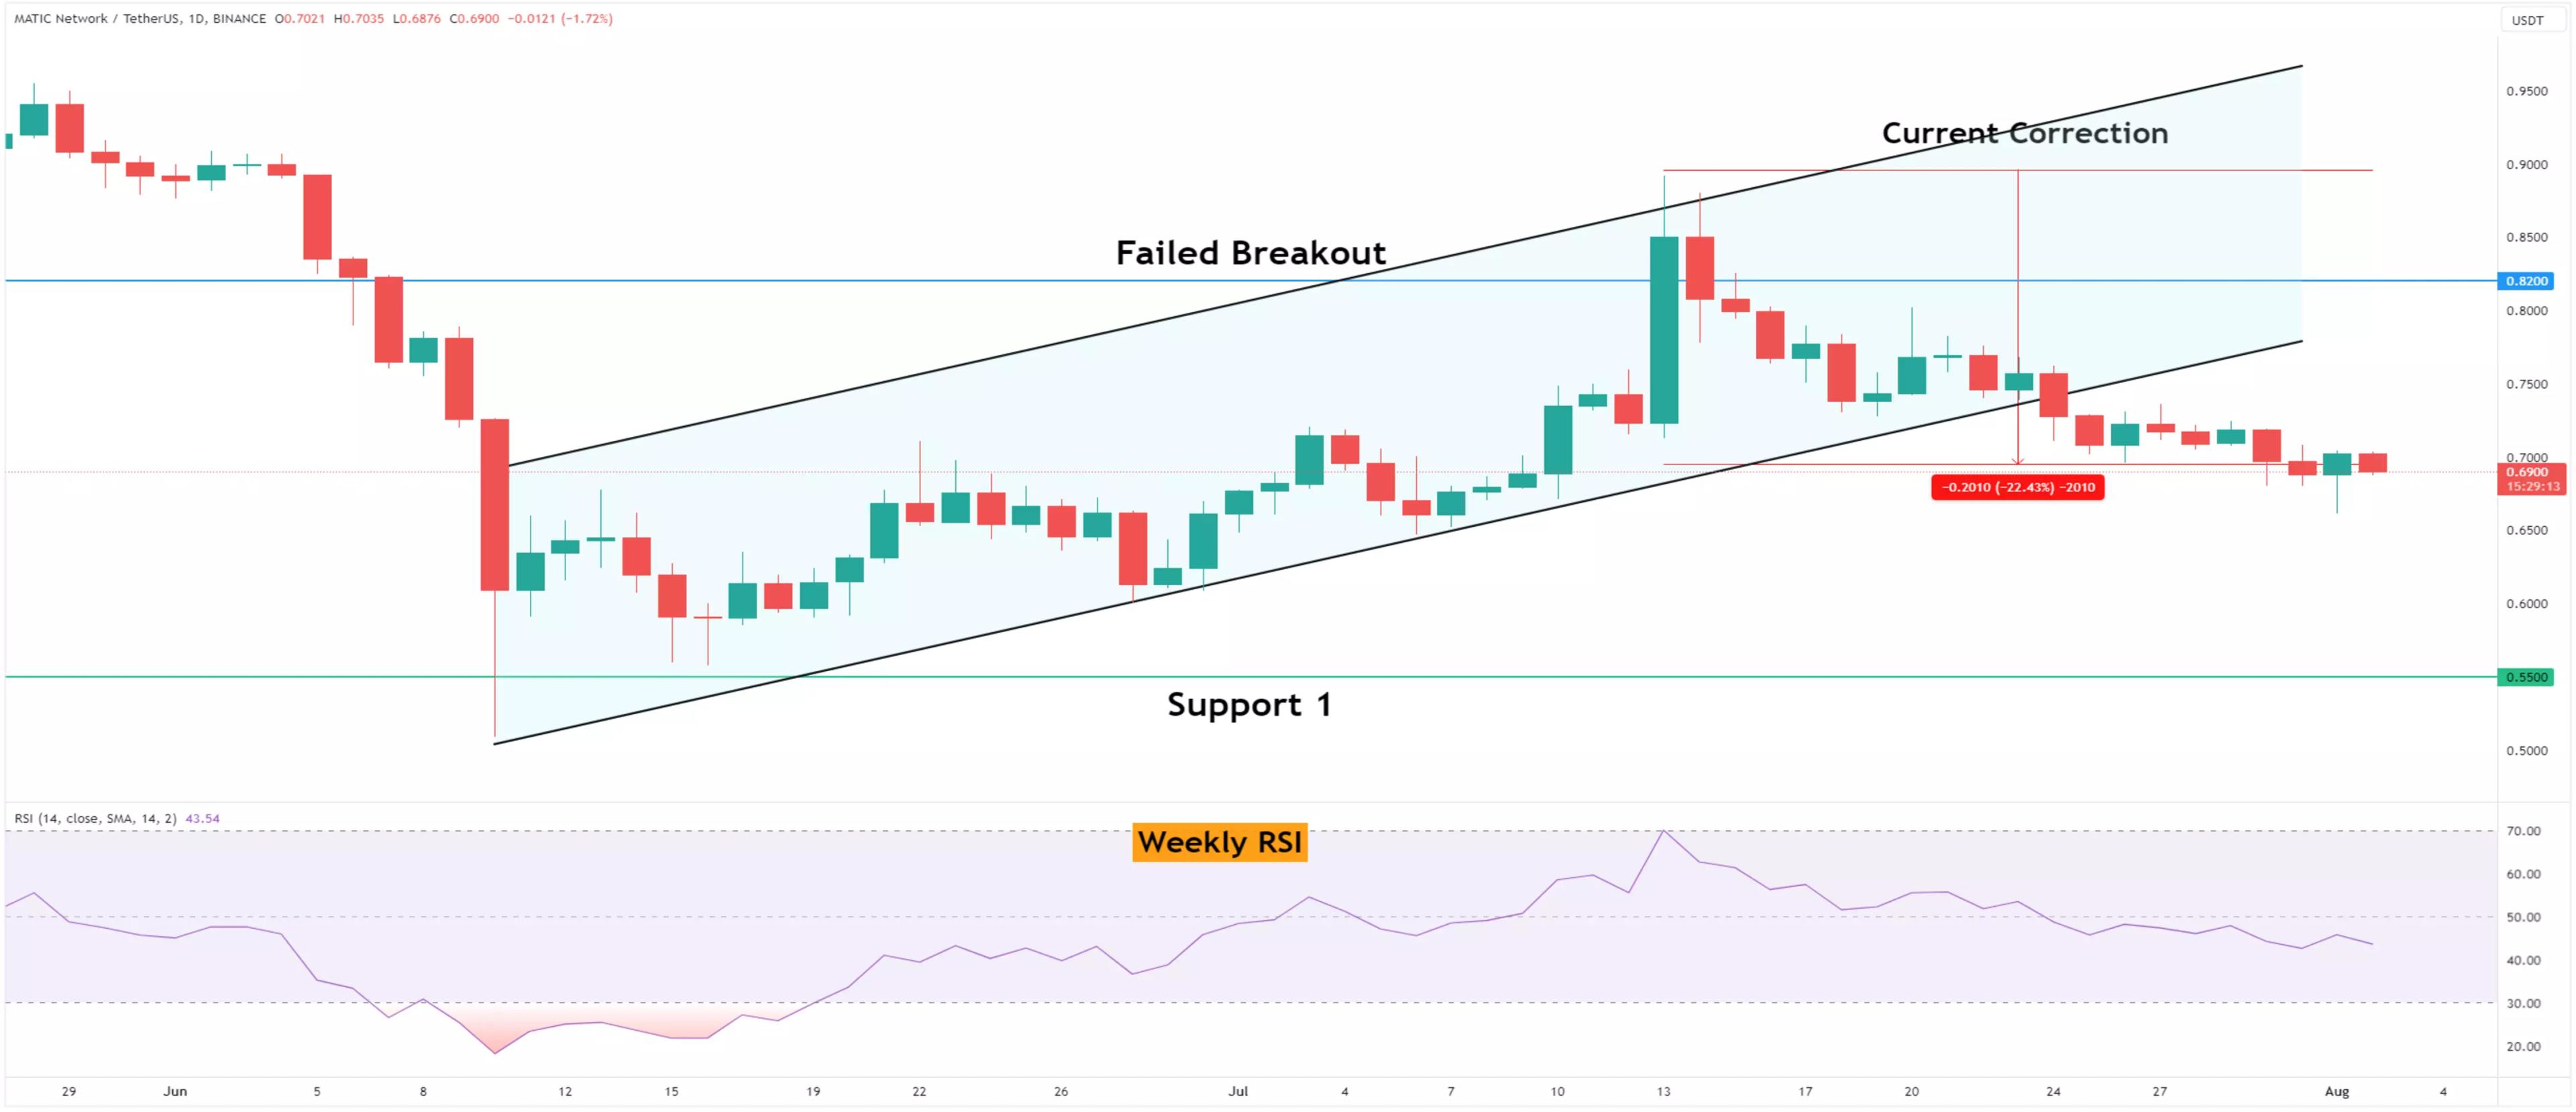
MATIC failed to break through a critical horizontal resistance area, leading to a breakdown from a short-term corrective pattern. This decisive rejection indicates a bearish trend, and if the breakdown is confirmed, it could lead to a new yearly low for the cryptocurrency.
Bearish Signals on Weekly and Daily Timeframes Cast Doubt on Immediate Recovery
On the weekly timeframe, the analysis shows a pessimistic outlook for MATIC.
It was rejected from the $0.82 resistance zone, which had previously acted as a strong support level since July 2022. The formation of a long upper wick on the weekly chart suggests increased selling pressure, indicating that sellers took control and pushed the price below the resistance area.
Additionally, the weekly RSI supports the bearish sentiment, falling below 50 and signaling a bearish trend.
The daily analysis further supports the bearish sentiment, as the breakdown of an ascending parallel channel suggests the completion of the upward correction and a resumption of the bearish trend. The daily RSI also falls below 50, reinforcing the bearish outlook.
Since the breakdown, the MATIC price has already fallen by 7%, and if the decrease continues, the next support level is at $0.55, implying a potential further decline of 20%.
Bottom Line: In summary, the recent price collapse in Polygon (MATIC) raises concerns about a potential new yearly low, given the bearish signals from both the weekly and daily time frames.
Chart by TradingView


_webp.webp&w=3840&q=75)
_webp.webp&w=3840&q=75)


