Ethereum’s Rally Could Gain Pace If It Clears this RSI Trendline
Ethereum (ETH) gained over 100% from its mid-June low, experiencing the most substantial rally this year. However, one question that is on the mind of everyone is whether this is the beginning of a long-term recovery or we’re just witnessing a dead cat bounce.
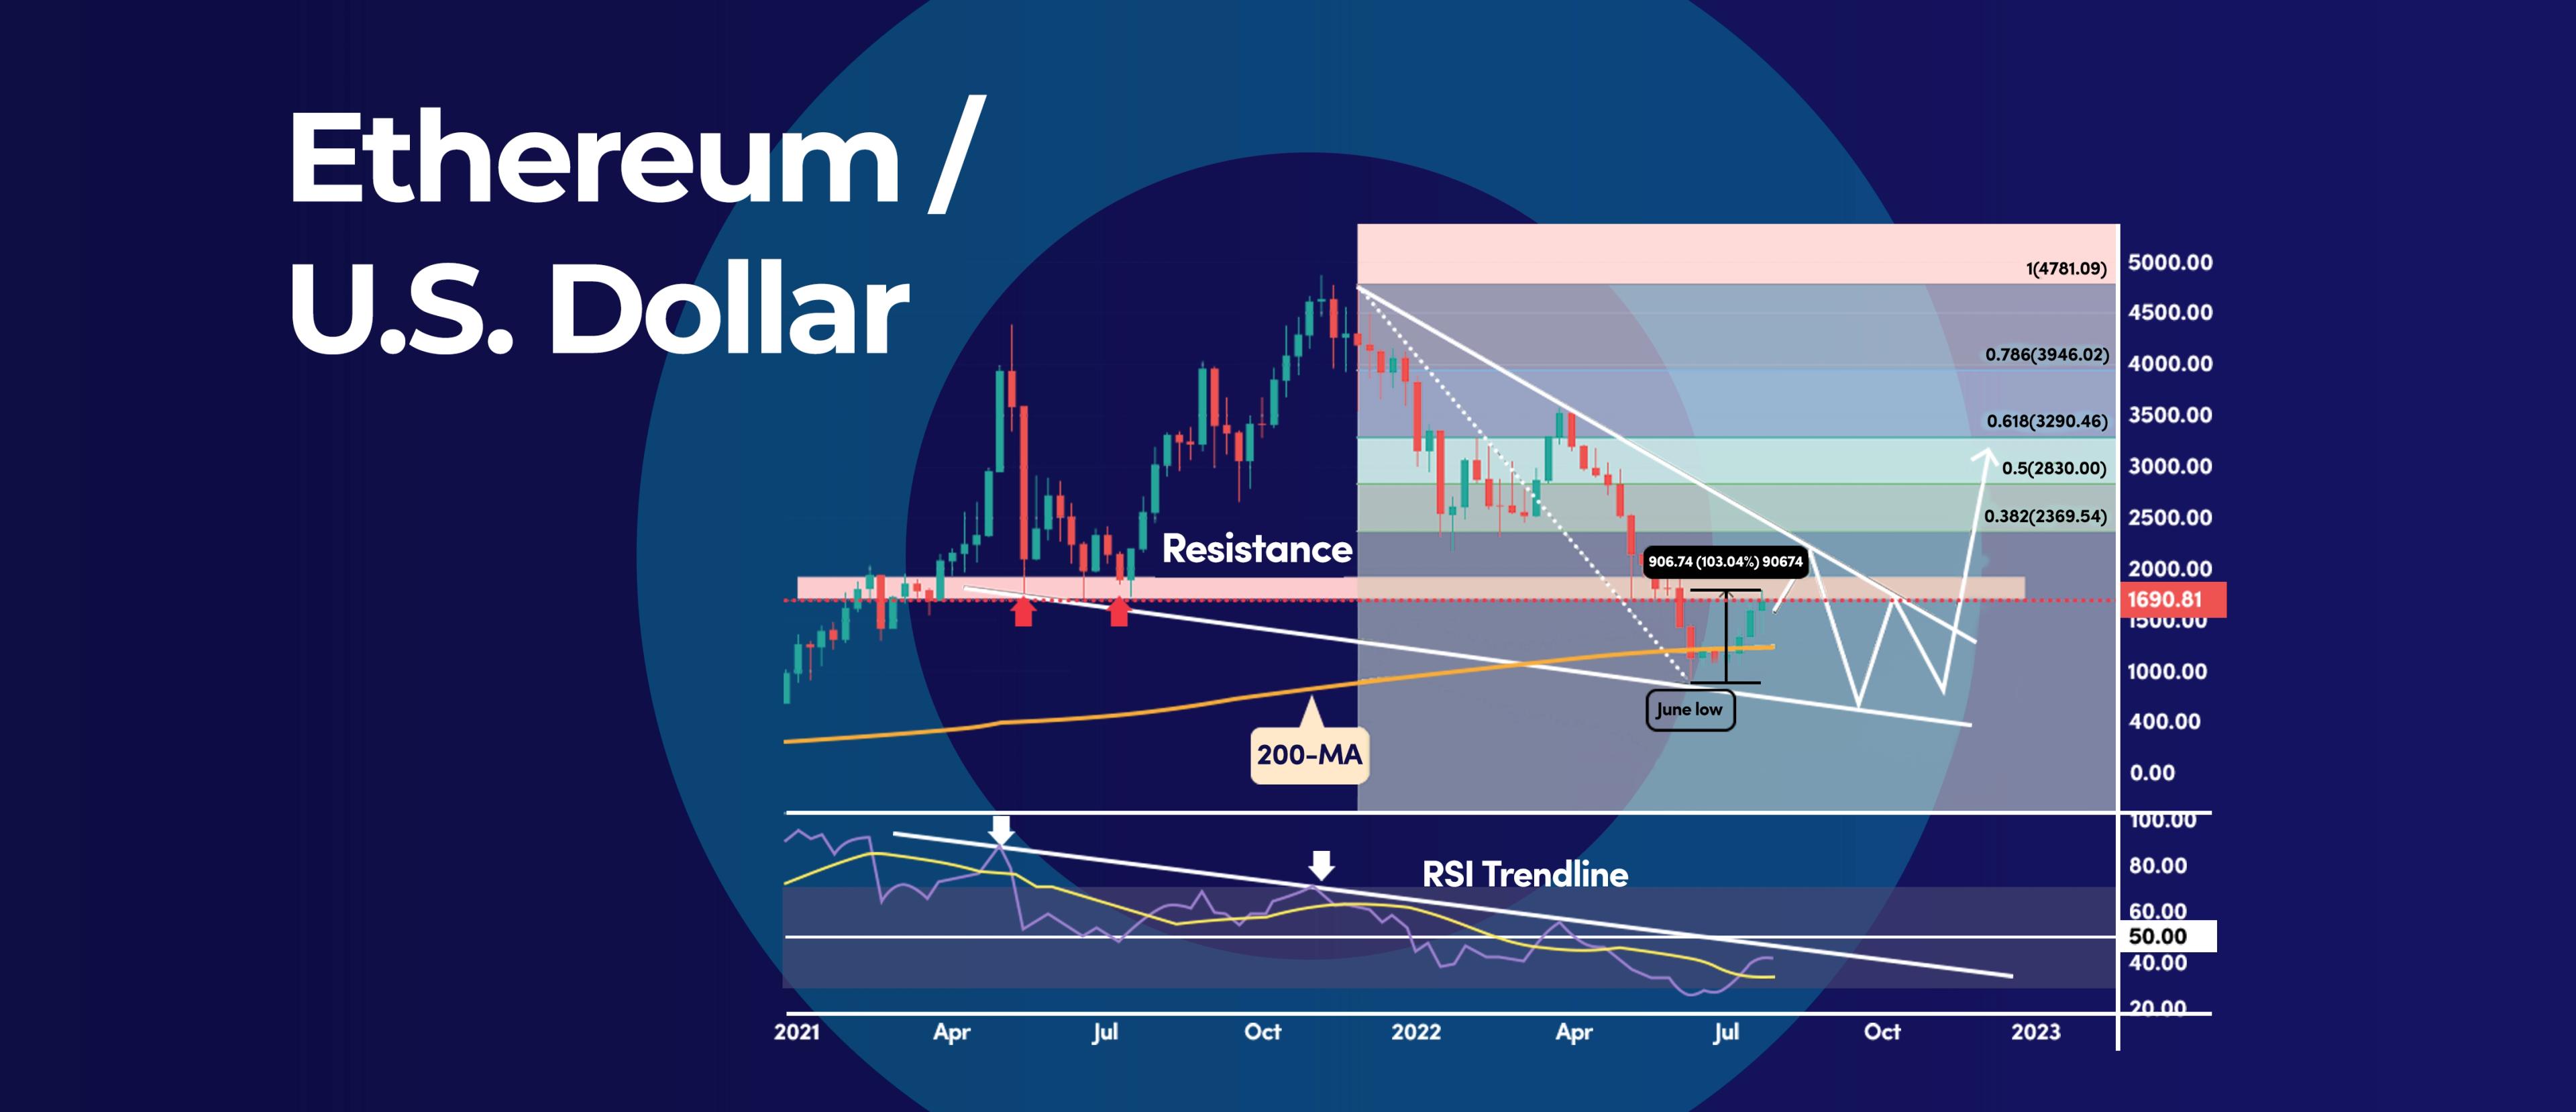
RSI Trendline
On the weekly time frame, ETH is attacking a key Relative Strength Index (RSI) trendline, which, if cleared, can signal more gains above the $2,000 psychological level.
Basically, the RSI trendline connects the peaks in momentum, and a breakout above is a clear signal of a shift in the market sentiment.
Usually, momentum precedes price, which means that price should follow the lead of the RSI trendline breakout.
However, for a more conservative approach, we can wait for the weekly RSI to break above the 50 mid-level.
What is the RSI Trendline?
The RSI Trendline is a tool that technical analysts use to help identify whether a stock or crypto is overbought or oversold. The RSI is calculated by taking the average of the item’s gains and losses over a certain period of time, and then dividing that number by the average true range.
The resulting number will be between 0 and 100. A reading of 70 or above indicates that a item is overbought, and a reading of 30 or below indicates that a item is oversold.
Short Term Resistance
In the short term, ETH has reached a price zone of solid resistance level from $1,700 to $1,900.
At the same time, the Ethereum price climbed for four consecutive weeks – one of the strongest bull runs so far this year.
While cryptocurrencies have recovered from steep declines in the past, we still need to wait for the above signals to materialize.
Usually, the recovery in the cryptocurrency market is tied to the 4-year halving cycle.
For example, the last bear market lasted 2.5 years, while the current bear market length has entered its 10th month.


_webp.webp&w=3840&q=75)
_webp.webp&w=3840&q=75)


