Why Bitcoin can Bottom at $10,000 Big Round Number?
Bitcoin (BTC), which hit an all-time high of $69,000 in November 2021, has been in free fall amid a broader market meltdown and is now down around 70%. So while Bitcoin is battling the $20,000 big psychological number in the short-term, the real bottom could even be around the $10,000 mark.
Bitcoin's 4-Year Halving Cycle
Bitcoin's 4-year halving cycle has a great impact on the long-term price projection and has helped investors map the price action with great success.
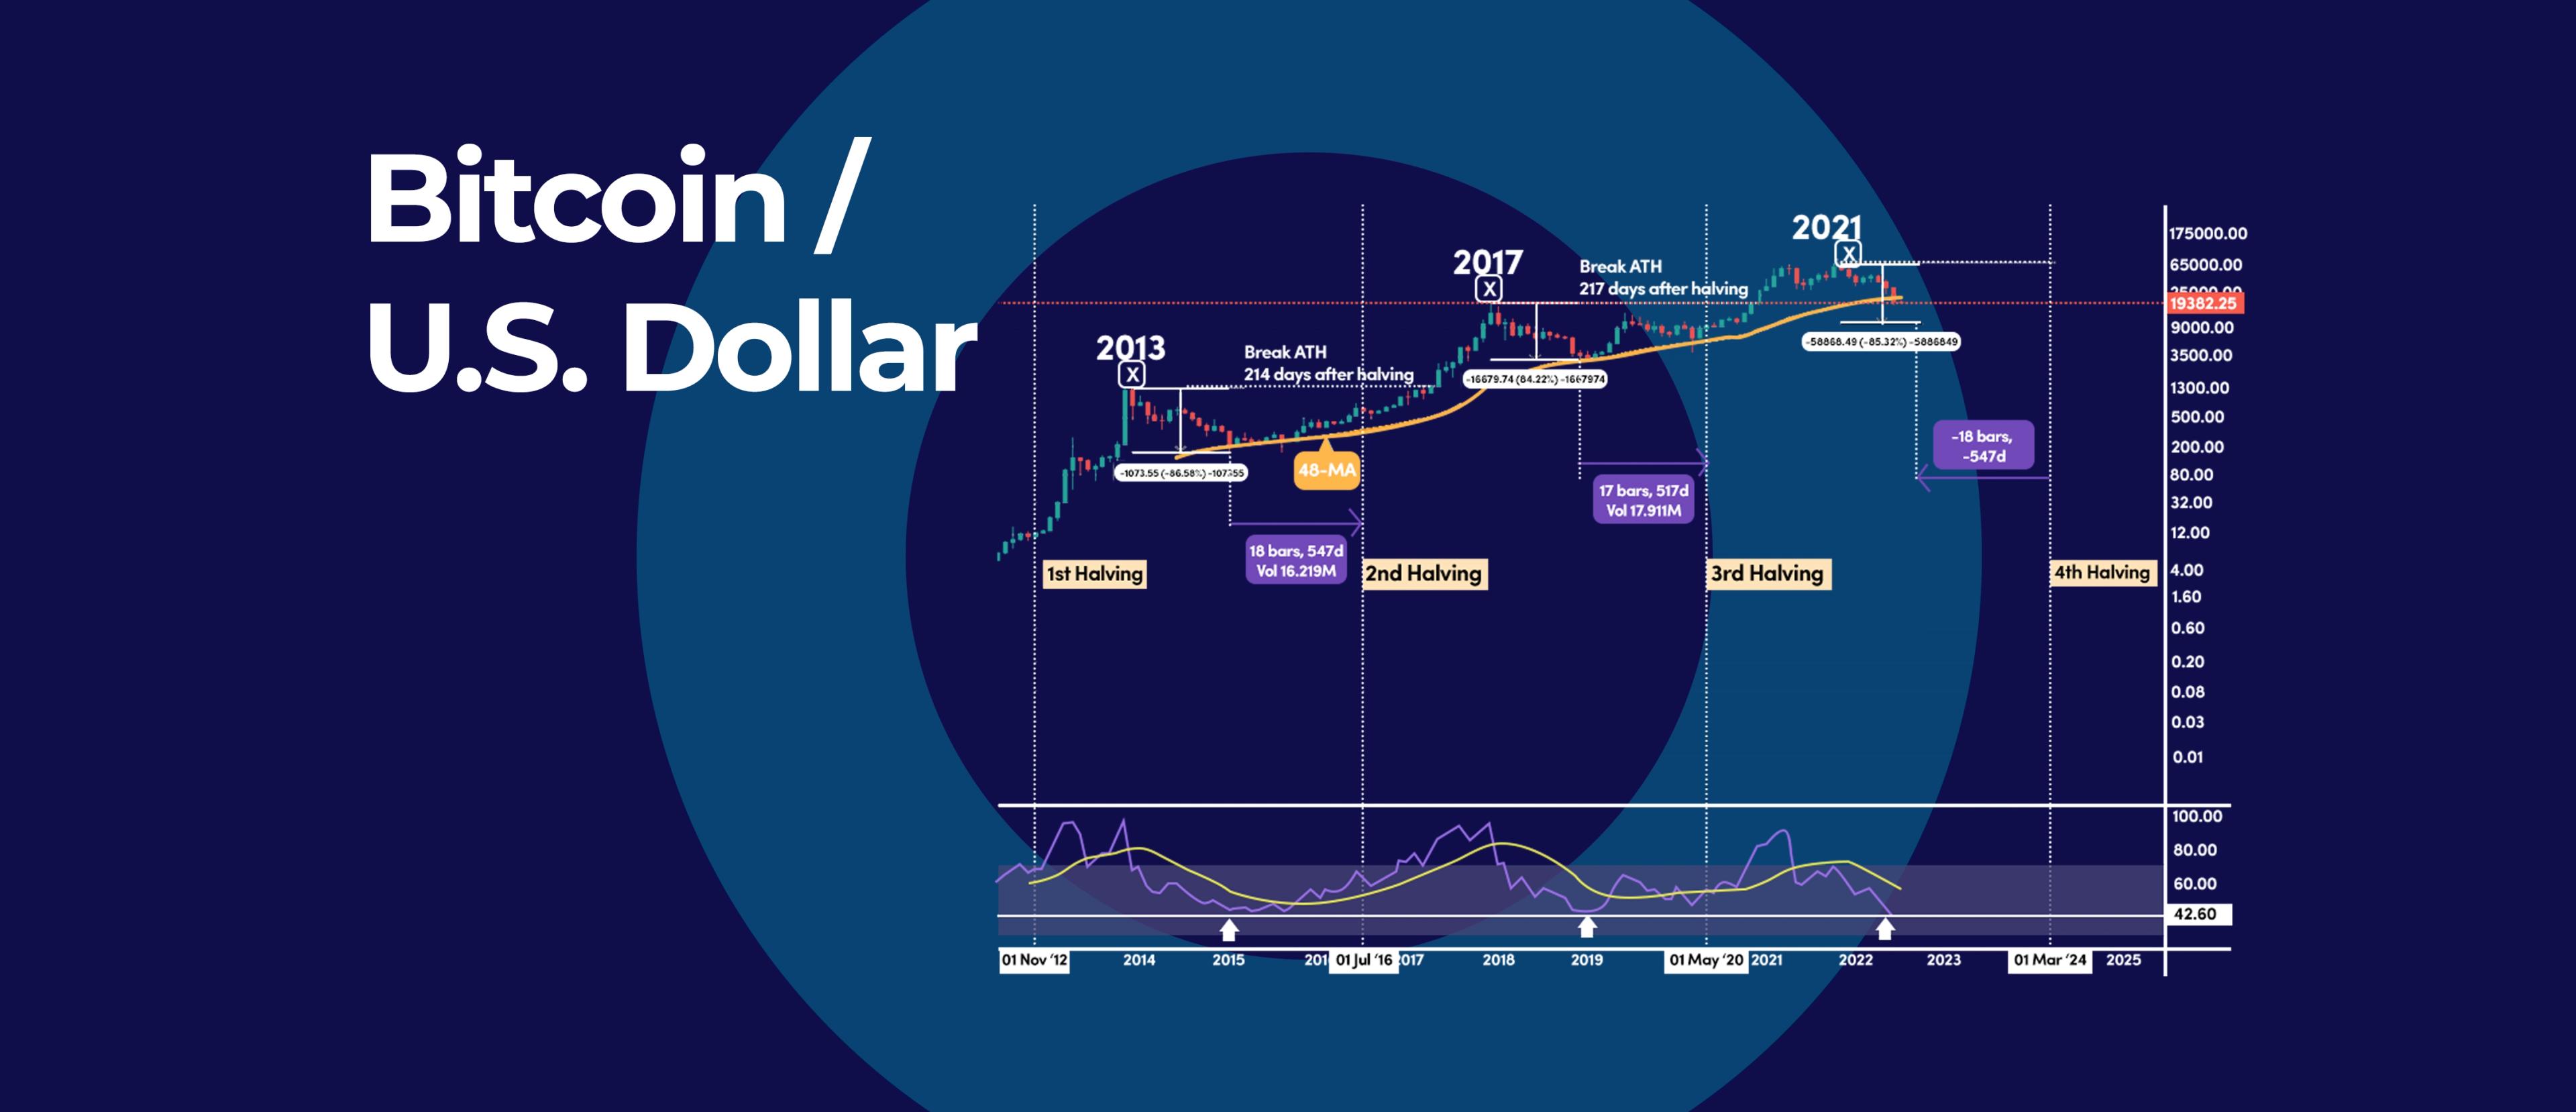
The 4-year cycle model suggests that Bitcoin price could plunge on average around 85%, which will put us near the $10,000 round number.
However, since volatility in the crypto market is generally less than in the beginning, we can also assume that Bitcoin may not fall quite as low, and we may fall only around 80%.
In that case, the $14,000 support level may serve as the bottom, if the volatility in the crypto market keeps decreasing.
During the previous halving cycles, each subsequent cyclical high was followed by extreme sell-off periods:
From the 2013 high, the BTC price plunged 86%
From the 2017 high, the BTC price plunged 84%
Additionally, each halving cycle low was established 18 to 17 months before the next halving event.
The next halving event is scheduled to happen on March 2024, which means that if we measure 17-18 months back from that period, we need to hit the next cyclical low somewhere around September-November this year.
RSI Oscillator
By comparison, during the previous halving cycle low, the monthly Relative Strength Index (RSI) oscillator was near the 44 reading and today's RSI reading is near the same momentum readings.
While we need to wait for the monthly candle close to get the final RSI reading, the next 2 months are critical as, ideally, we would need BTC's price to have a swift move to the downside to re-test $10,000.
This should be followed by a speedy recovery so that the monthly close is around $20,000, which will give us a perfect "V" shape bottom.
However, a more realistic approach would be to have a long consolidation period near the bottom first before recovering, thus having a "U" shape bottom. This "U" shape bottom occurred following the last 2 sell-offs. Therefore it is most likely to transpire again.