This Chart Pattern Calls for Algorand $1.0 Target
The technical chart suggests that Algorand (ALGO) has the potential to tag the $1.00 milestone again. The downswings since February 8 can be confined within a descending channel, with the swings getting shorter in magnitude and the momentum drying out.
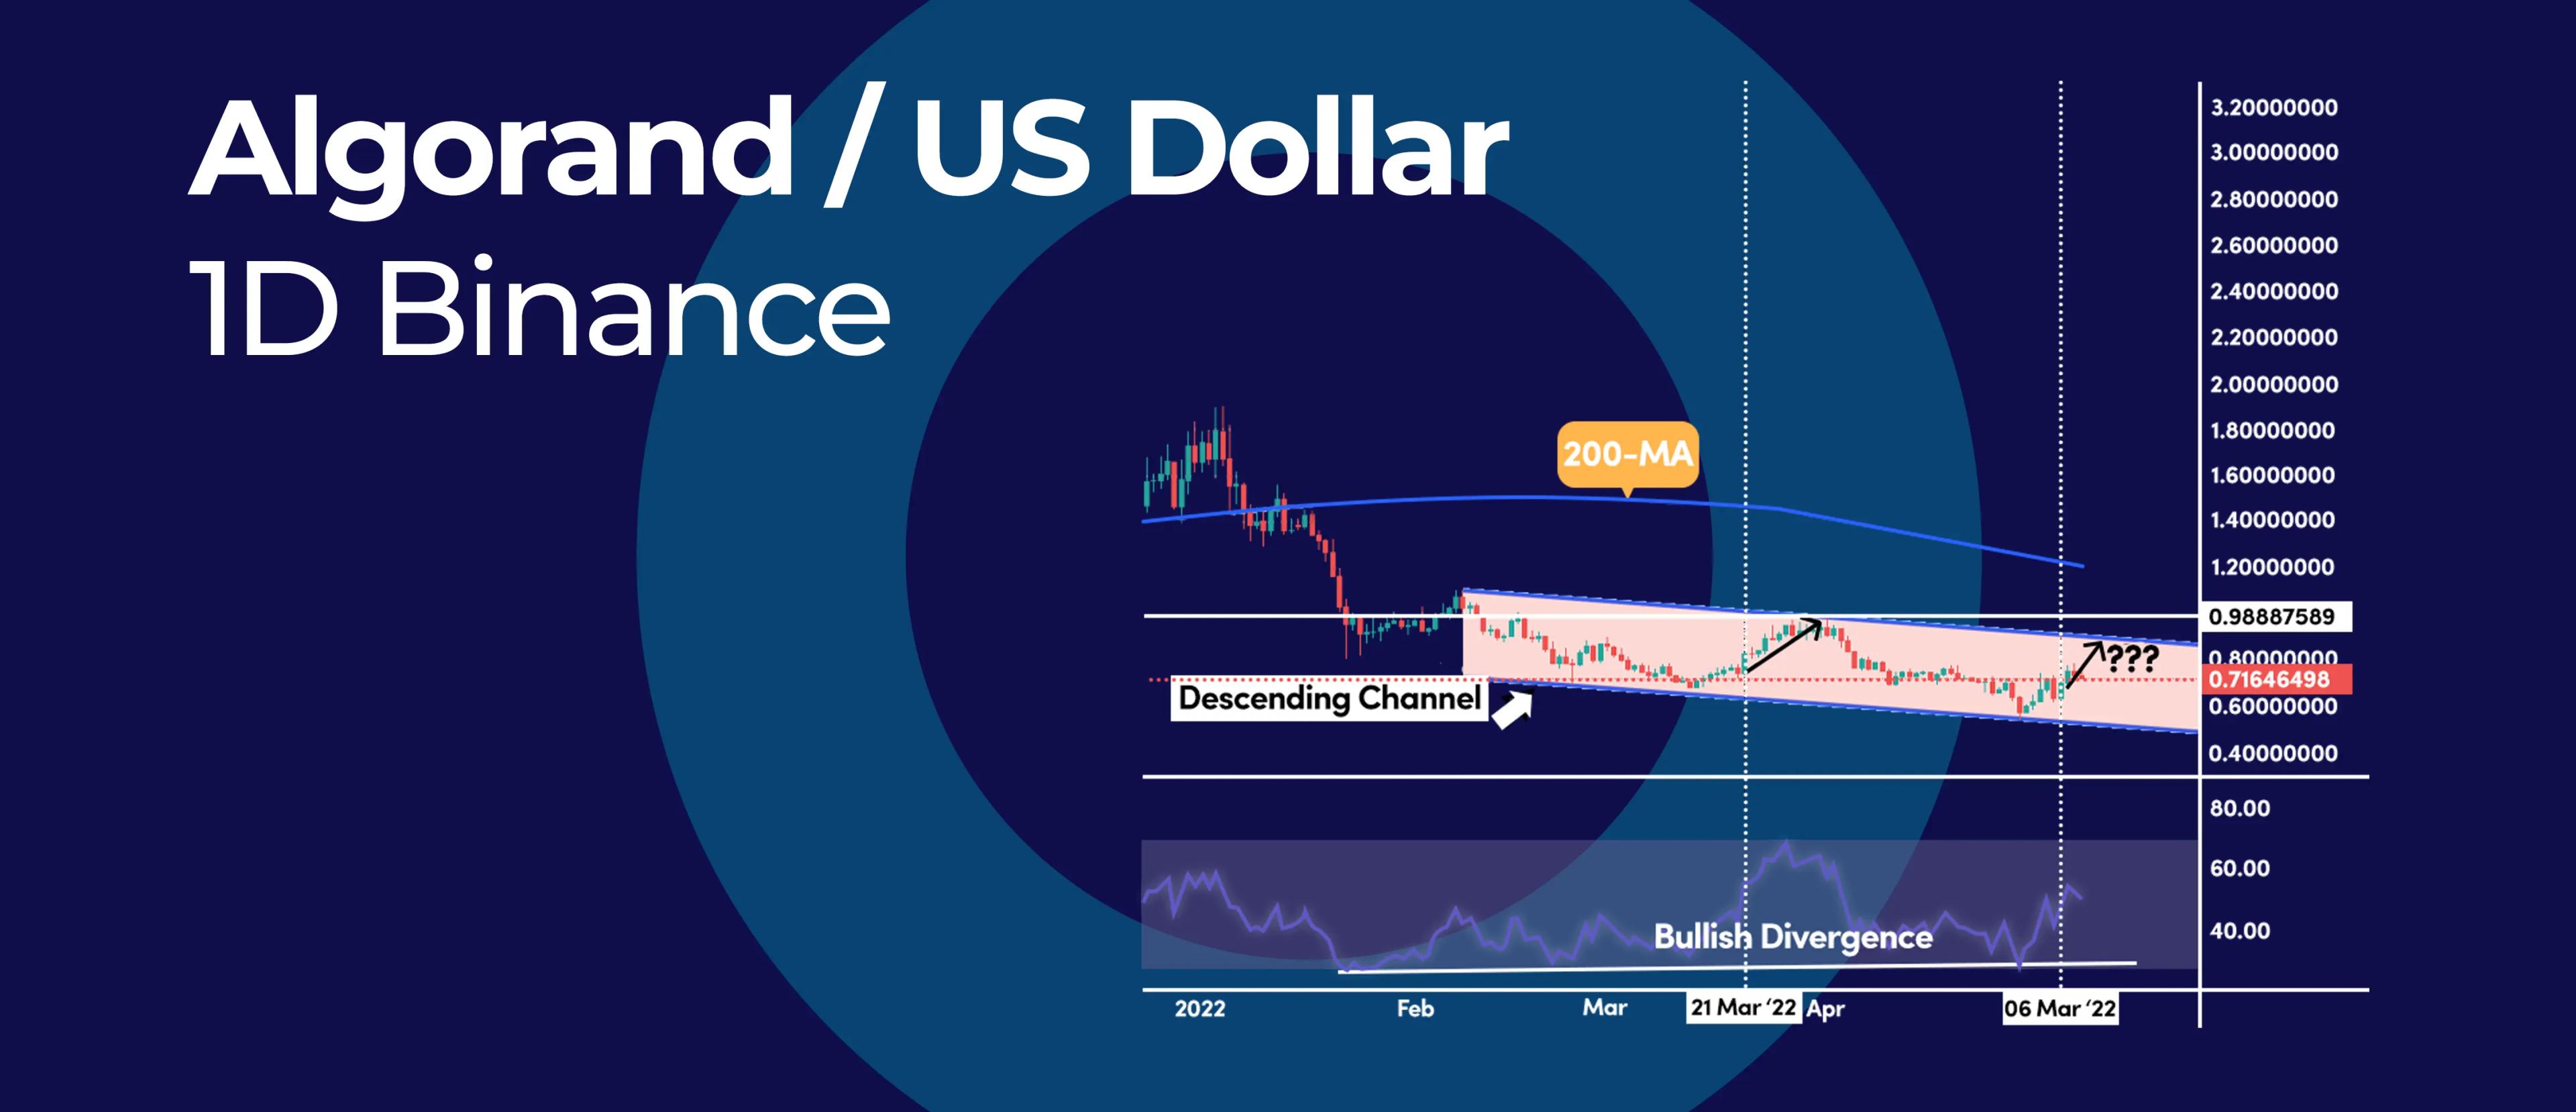
Algorand Descending Channel
After reaching the lower support trendline, the ALGO price bounced, and we're now looking for a possible retest of the upper resistance trendline, which falls near the $1.00 psychological level.
The current bounce is also supported by the Relative Strength Index (RSI) oscillator, which broke above the 50 mid-level.
The last time the RSI broke above the 50 mid-level on March 21, ALGO's price retested the upper resistance trendline.
The pattern, if confirmed, could set off a much larger rally in the coming months.
However, for a meaningful reversal, we would need a daily break and close above the descending channel but, more importantly, above $1.00.
We also have a massive bullish divergence between the price and the RSI oscillator, which highlights the exhaustion of selling pressure. This is a significant price development because it has the potential to call for a potential bullish reversal.
What is a Descending Channel
A descending channel is a technical analysis pattern, where the price moves between a downward sloping parallel line, which is the resistance trendline, and an upward sloping line, which is the support trendline.
Looking forward
We have to keep in mind that the overall trend is bearish as we're still trading below the 200-day simple moving average, and in terms of the price structure, we are still following a bearish path.
However, we might be in the process of a reversal if the pattern highlighted above is triggered.
As such, we will be monitoring the price action and the RSI oscillator closely. We will be looking for a daily close above $1.00. If this happens, we will be buyers on the dip. If the $1.00 level holds, we will be sellers.


_webp.webp&w=3840&q=75)
_webp.webp&w=3840&q=75)


