
The Early Signs Of Reversal For Bitcoin, S&P 500, And Gold
Global markets have had a period of unprecedented volatility ever since the Coronavirus crisis started. In the previous blog we explored the behavior of BTC, S and P 500 and Gold amid the crisis:
BTC lost more than half of its value in a single day before the price almost doubled from its lows in less than a month. Gold fell about 15% in one week before making a new 5 years high in the preceding 2 weeks.
The stock market lost over 35% of its value in a month before regaining over a quarter of its value in 2 weeks.
In this blog, we will identify the early signs which you can look out for in order to determine whether the crisis is coming to an end based on technical analysis, fundamentals, and data about the virus itself.
Let’s now identify the early signs of a reversal for the different markets:
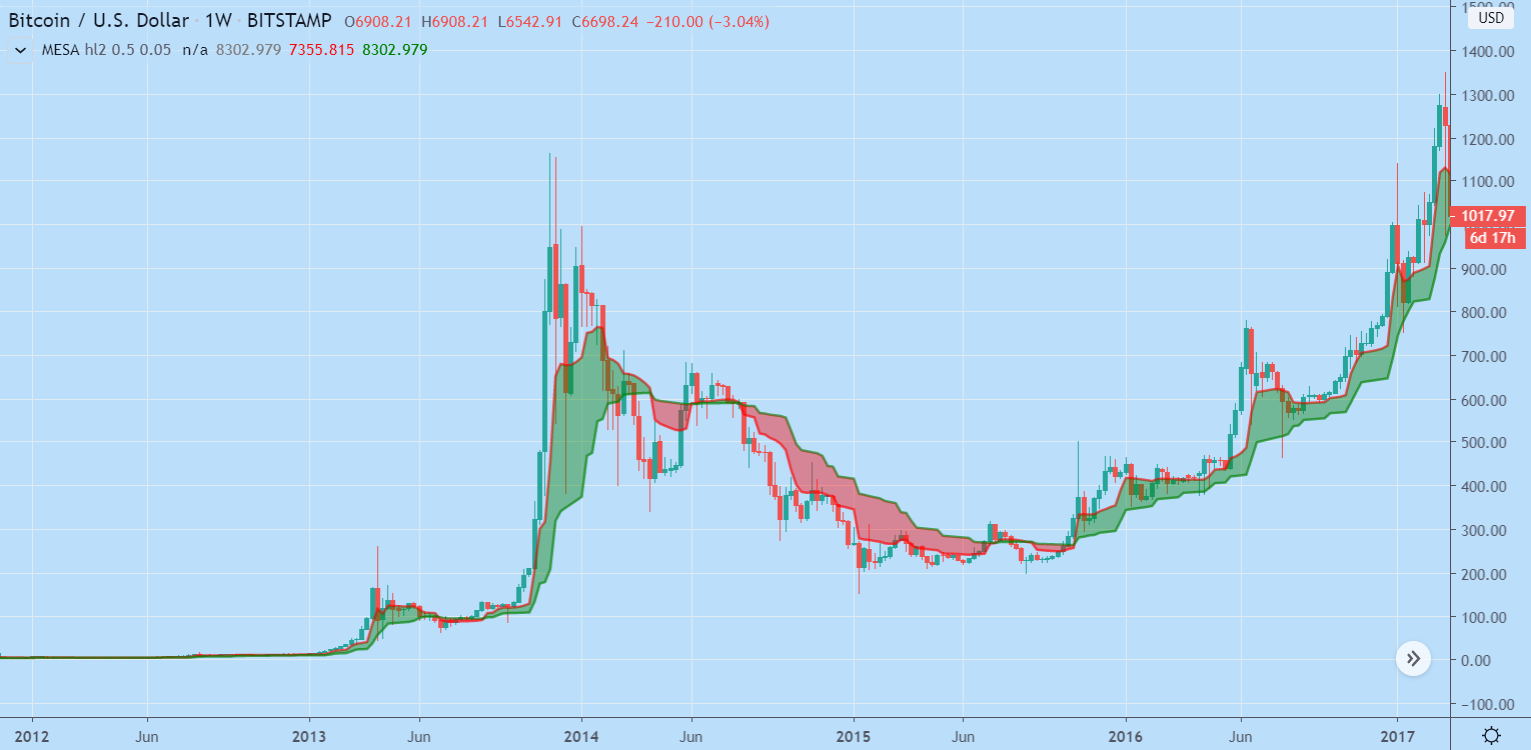
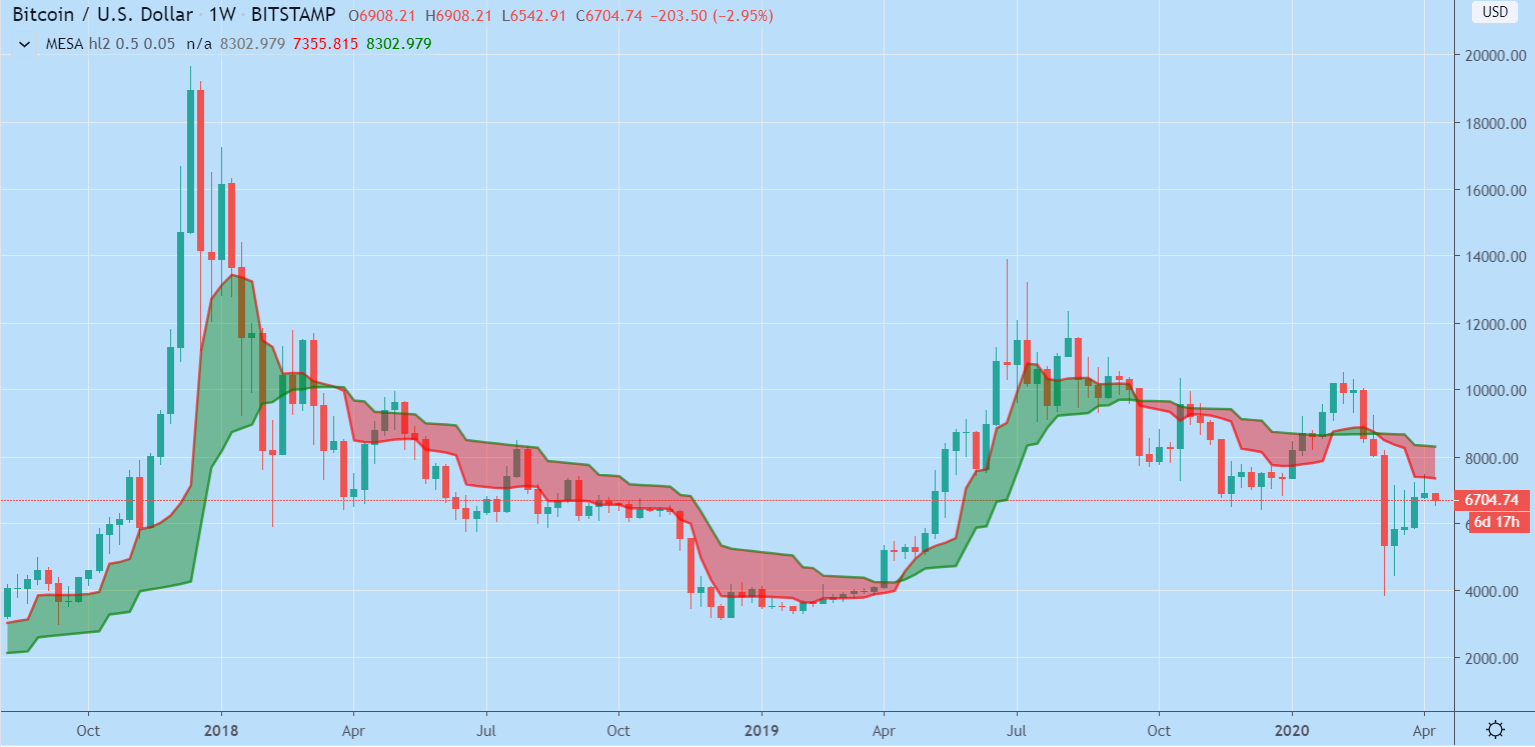
Bitcoin
Technical analysis:
The MESA on the weekly timeframe can be considered a very good indicator that has been proven to work in the past. This indicator worked very well over the long crash between 2013 and 2015.
It then also worked well again in predicting the rise in April 2019 after the one and half year long crash. Like with any other indicator, it is possible to receive “fake signals” but those are usually short-lived.
Fundamentals:
Fundamentally, as discussed in the previous blog the crash likely resulted from a general panic and people not having enough funds to support their daily life due to the loss of their job.
In order for the fundamentals to make a turnaround from this situation, one can use the unemployment rate. When the unemployment rate starts to decrease and is back to the levels prior to the crisis and the quarantine, the retail investors should start coming back to the cryptocurrency market.
When the stock market starts its ascend, we should also see the same happening in the cryptocurrency market as the institutional investors should come back to the market.
Additionally for BTC, we are also very close to the halving at this moment with only 1 month away.
In our last technical analysis post on Tradingview, we have described that we expect BTC to reach 10,000$ on the day of the halving and then to rise around 1,000% in the following 2 years.
As such, we would also expect the halving to drive the price strongly upwards once the effects of the crises are milder than at this moment.
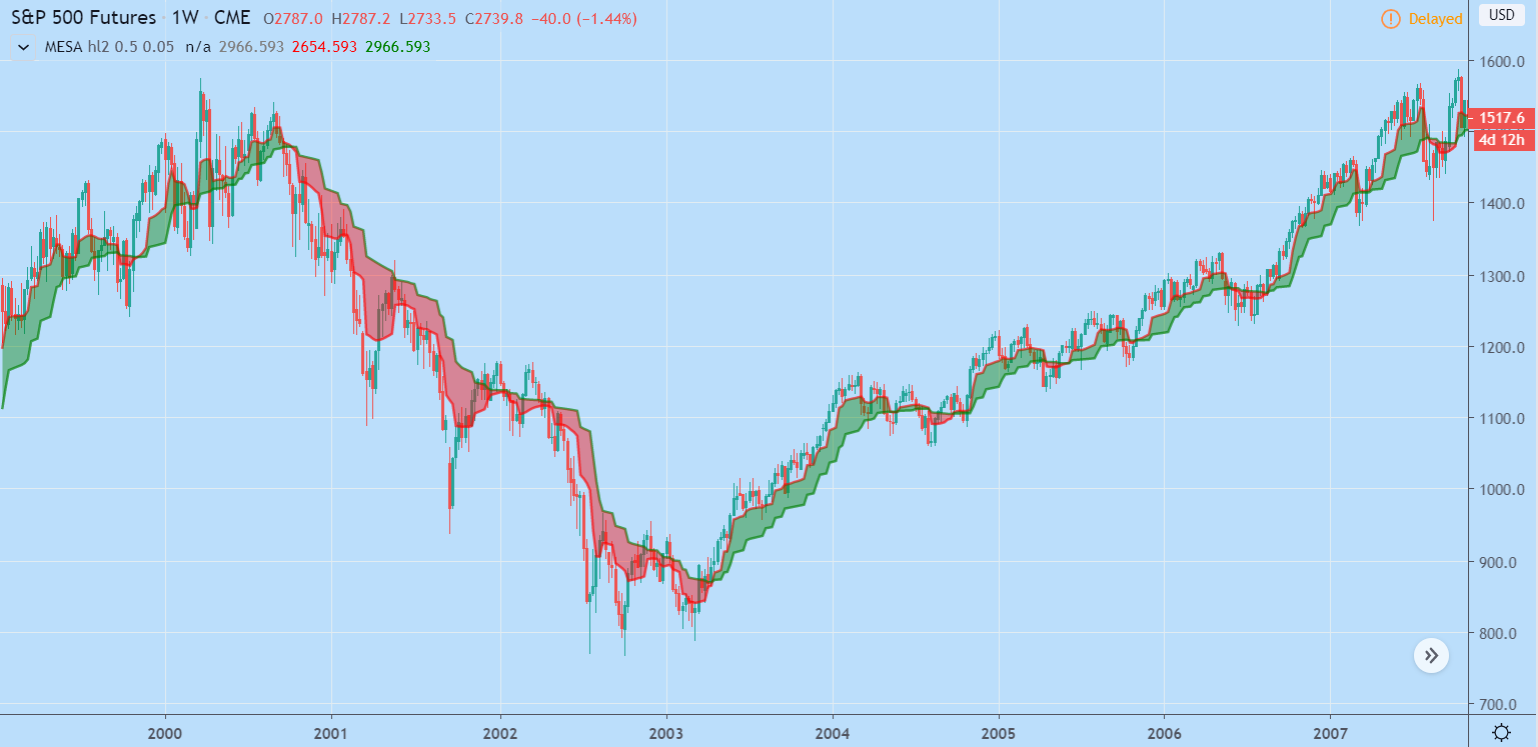
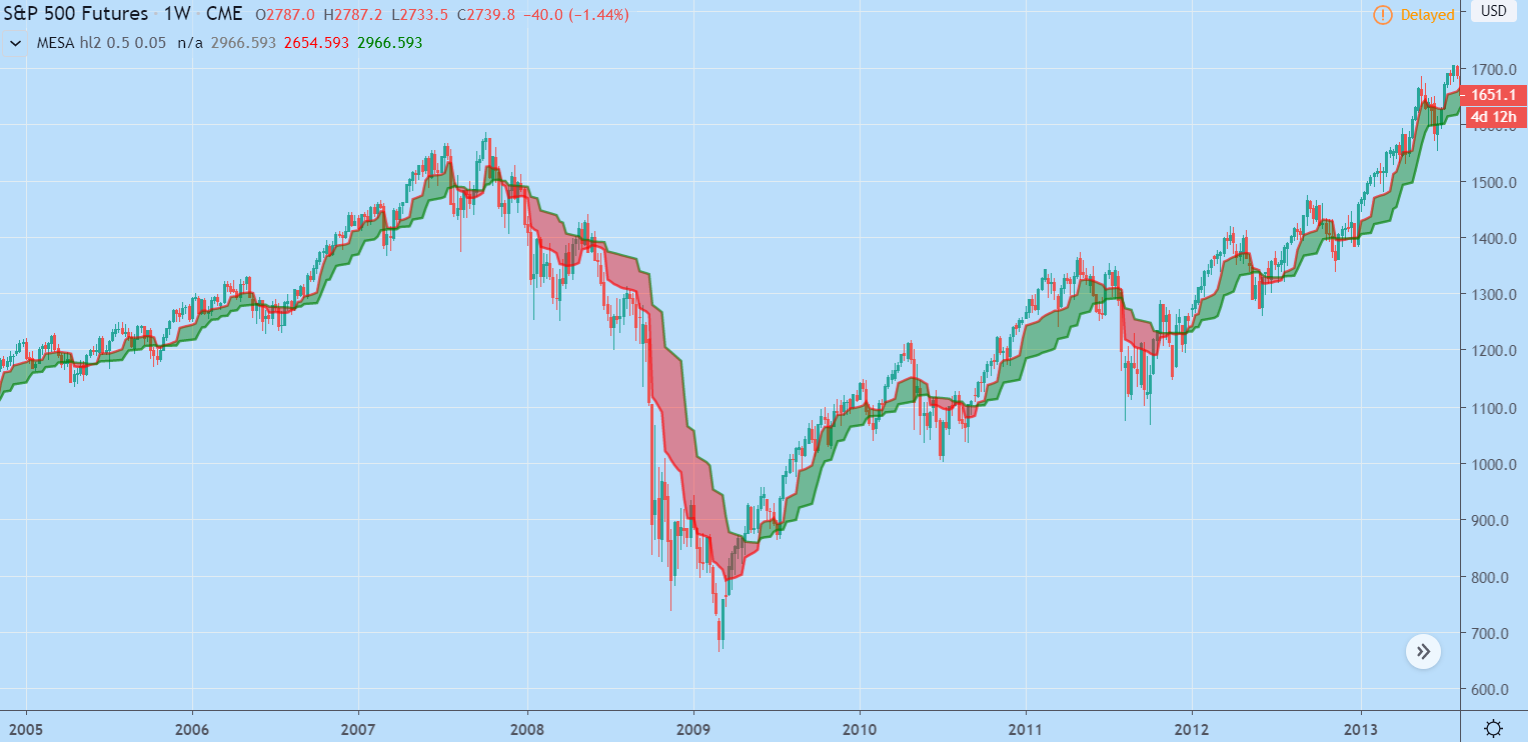
S and P 500
Technical Analysis:
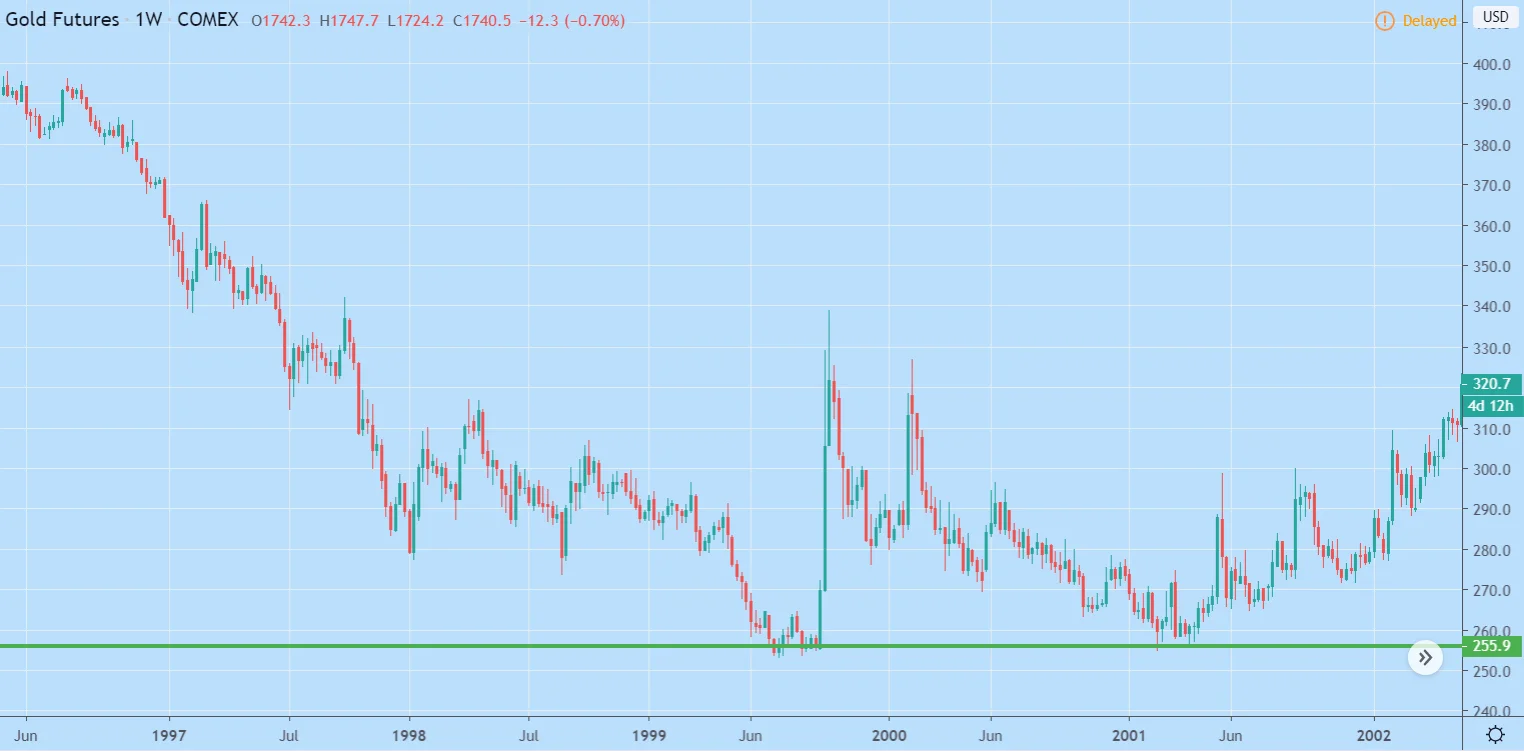
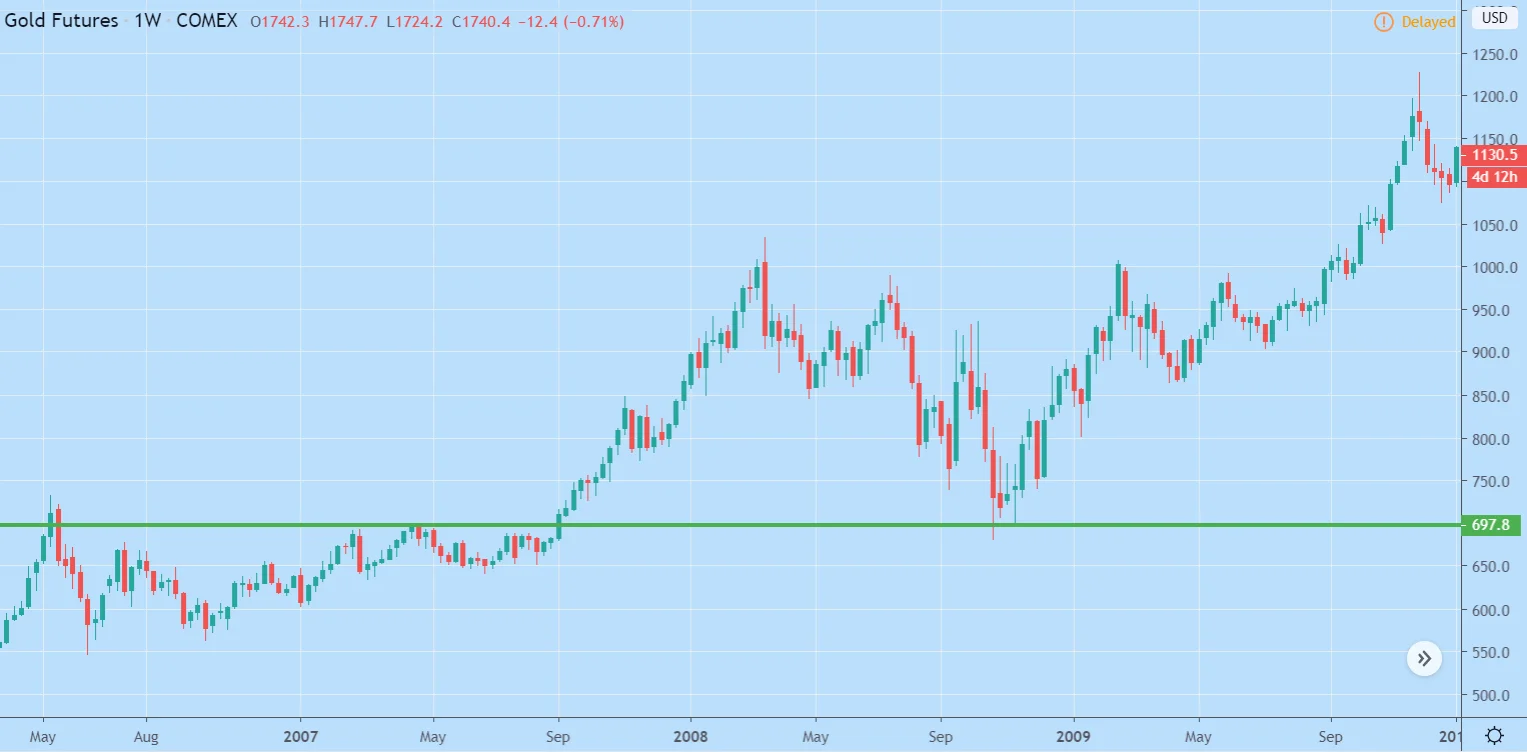
The MESA on the weekly time frame works even better for the S and P 500. As shown in the screenshots below, the indicator did not give any fake signals during the Dot Com bubble in the early 2000s and the Great Recession.
Fundamentals:
The unemployment rate is even more important for the stock market than it was for the crypto market. The unemployment due to the lockdown did not only hurt the retail investors as they no longer had funds to invest; but also the companies employing them as they could no longer afford to pay their employees.
In many countries the quarantine closed down all “non-essential” businesses in order to contain the spread of the virus.
This means that the production of goods for most companies has been severely reduced or stopped altogether. If a company cannot produce and sell its products/services it goes without saying that the respective company cannot be profitable and as such these companies will decrease in value.
As such the early signs of reversal for the stock market to watch out for:
Unemployment rate
Relaxation of quarantine measures
Although the government and Federal Reserve is pumping money into the economy and it might alleviate pressure in the short term, it is not sustainable for the long run.
Eventually, we will need the signs mentioned above in order to turn the economy around.
Gold
Technical Analysis:
Out of all of the assets described in this blog, gold is the hardest to identify when it has reached a bottom and when it is on its way of a reversal.
Unlike with the other two, most indicators do not work well here, and as such we will have to use support and resistance.
During the Dot COM bubble, the price of gold bottomed at the strong support line which was last tested in the summer of 1999. During the Great Recession, the strong resistance line from May 2006 to September 2007 acted as support.
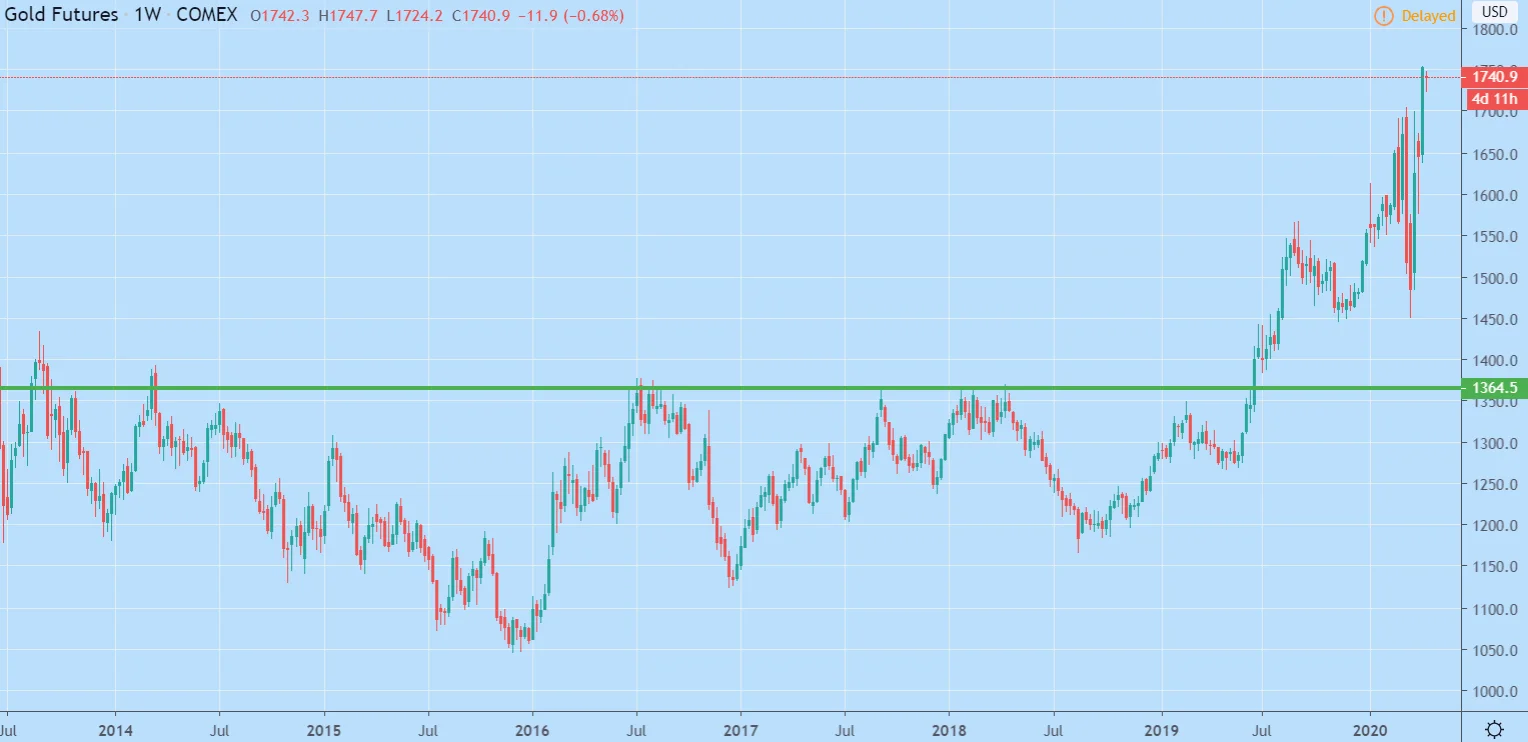
In our case, the support line at 1,360$ seems to be very strong and that might be the place Gold rebounds, if it ends up selling more.
Fundamentals:
As with the technical analysis, the fundamentals with gold are also harder to identify and portray than with the 2 other ones. As we have stated in our previous blog on the subject, gold can decrease because:
Investors fear a lower demand for the premium commodity
Traders may sell their Gold positions in order to offset their losses in the stock market and elsewhere and to rebalance their portfolios.
There is a general fear among investors, that central banks will sell off some of their gold reserves in order to help out their economies.
In order for these to change, the world economy needs to rebound. Good signs to watch here will be the same as for the stock market:
Unemployment rate
Relaxation of quarantine measures
However, with Gold, we have some additional fundamental reasons why the price can increase even more: the governments.
The governments have been pumping large amounts of funds into their economies. The Federal reserve funded the economy with 700$ billion. The US government eclipsed that when Congress unanimously signed a 2.2$ trillion rescue package.
This increases the inflation of the Dollar and as a result the prices of all commodities against the dollar. Many countries followed the example of the United States in order to alleviate the pressure on their economies.
Currently, there is a large spread between the spot price and the futures price with the futures price being significantly higher than the spot price. This suggests that the price of Gold is likely to increase even further in the future.
Coronavirus Data
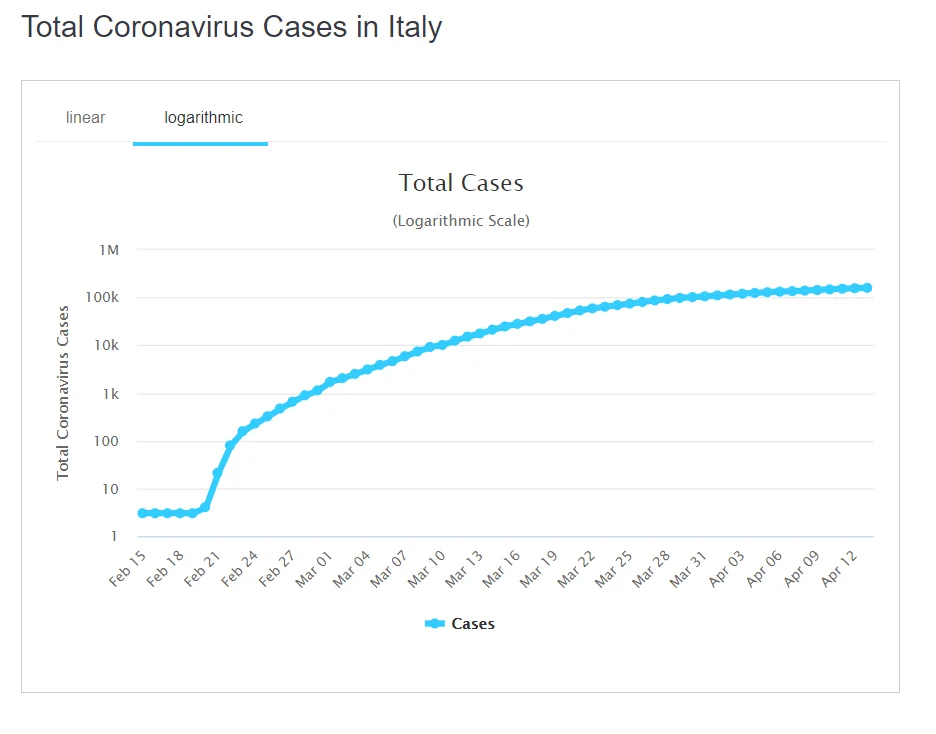
We can also identify when we are on our way to recovery based on the data regarding the Coronavirus gathered from here. In order to predict the future, we have to look at the past (in our case a very recent past).
We will thus examine how the Coronavirus cases affected Italy, what the early signs of a reversal were.
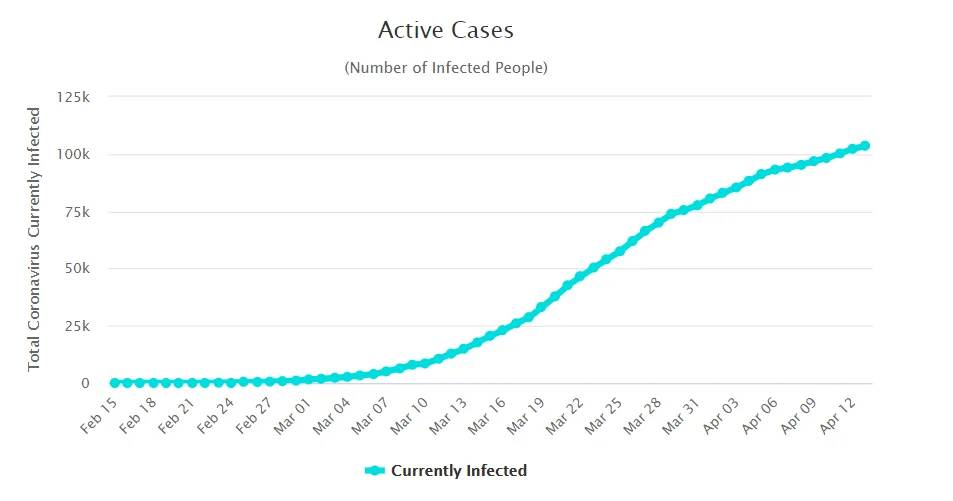
In order for the number of active cases to start decreasing, it is important first to have the cases on the logarithmic scale flatten. This means that the disease is no longer spreading at an exponential rate. An example of this can be seen below:
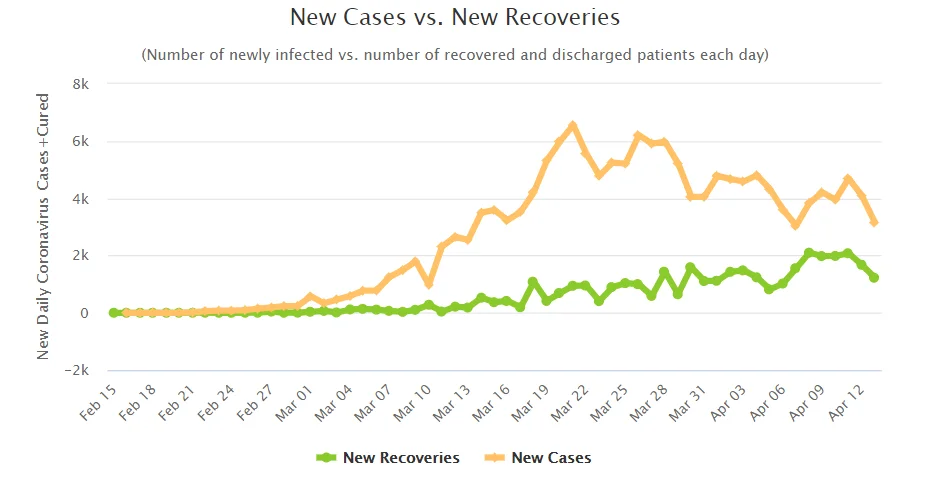
To predict when the logarithmic scale will flatten we have to look at the number of daily cases. Here we need three days in which the highest number of daily cases has not been surpassed. As can be seen with Italy, once this happened, the number of new daily cases gradually decreased:
Last but not least, we need to start seeing the active cases decrease. Once the active cases are decreasing, most countries will probably start opening up their economies again.
Of course, when the quarantine regulations start relaxing, and cities start coming out of lockdown and the economy starts to get back on track, we will know that the crises is nearing its end. However, by using the data above you can predict when this will happen for the world itself and for each and any individual country.


_webp.webp&w=3840&q=75)
_webp.webp&w=3840&q=75)


