
Trading 101: How to read a chart
True traders don't expect full certainty, but they do dedicate their time to removing as much uncertainty as possible. Step 1 is Learning to read a Chart
The first times you sit down in front of your computer staring at a chart you might see an incomprehensible spread of indicators.
A page filled with red and green candles going up and down in what seems like unpredictable directions. This will probably make you feel a bit lost if you’re new to trading.
Don’t worry, it’s all much simpler than it looks.
As a trader, it’s vital that you learn how to read a chart. It’s proper technical analysis of the chart that separates the real traders from the HODLers.
In this blog, we will walk you through some of the most useful aspects to read and analyze a chart of a certain crypto, stock or currency.
We will review elements such as candles, market gaps, trends, volume, supports, resistances and technical indicators displayed in a chart.
By diving into this topic, you will be learning a new skill set, which may, in fact, open up a new world of possibilities for you. The more you learn about how markets behave, the more likely you are to profit from this insight.
Candlesticks
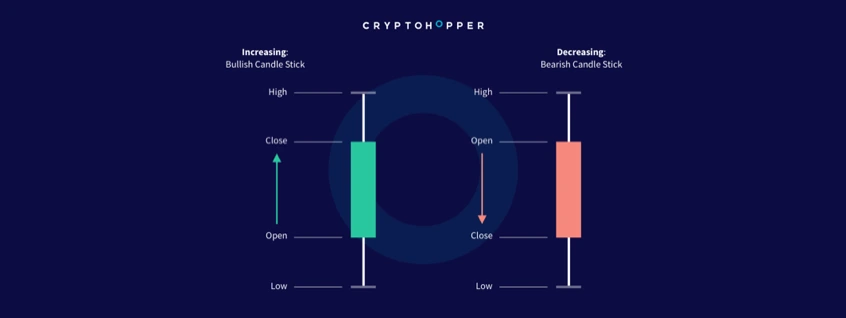
A candle chart shows a security’s price and offers information about whether bulls (buys) or bears (sells) have more strength and, therefore, can indicate the future price direction.
Candlestick shapes provide information about the opening/closing price and the highest/lowest price for a certain period of time that might range from 30 seconds to months, depending on the time frame selected.
There are several types of shapes, one of the most characteristic ones that can indicate more accurately the future price direction are the so-called hammers, named after a cluster of candles which together look like a hammer.
The hammer suggests that the price might reverse, since, in the case of a downward trend, a candle with hammer shape would indicate that the demand is pressing to drive the price up again and already doing it in that candle.
Market Gaps
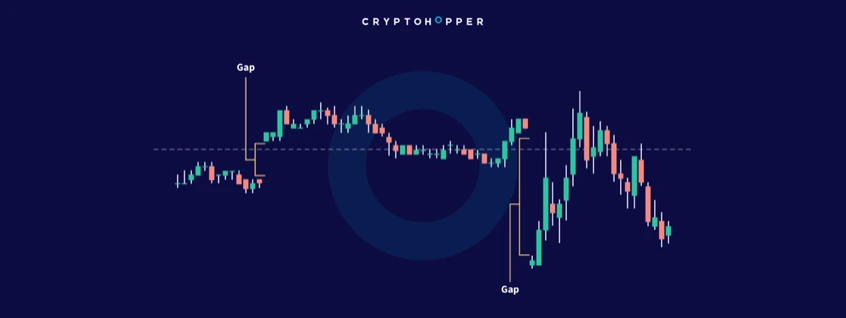
These are areas where the price moves very sharply after a market opens or any kind of relevant news is released. Then, the high volume drives the price up or down without any candle connecting the last and new one.
Market gaps are usually filled. This means that the price has gone back to its level right after the gap happened, therefore the gap was closed. What could drive the price back to its previous level? The better explanation for this correction might be a mix of a technical support/resistance and irrational exuberance.
Trends
Trends are sequences of the price of a certain asset marking maximums higher than the previous ones in the case of upwards trends, and series of minimums lower than the previous one for downwards trends.
In the case of upwards trends, a trend reversal occurs when the price has hit a new maximum that is below the previous one, and this keeps happening until the new reversal comes up. In the case of a downward trend, this occurs when the new minimum is above the previous one to thereafter go up. Simply put, this indicates a changing of direction for any given asset’s price.
Traders make use of technical indicators to pinpoint the continuation or potential reversal of the trends. Trends can be traded in very short, short, medium and long-term time frames depending on the candle sizes, which determine the kind of trader you are, scalper, day-trader, swing-trader or position trader respectively.
Volume
Volume is one of the most important aspects to take into account while analyzing a chart and price movement and in most trading charts you can find volume running across the x-axis.
The volume of a certain asset indicates the number of contracts traded at a point of time, depending on the candle size. It indicates the price strength going up, down or ranging. Most of all, it is a reflection of demand/supply for a certain asset.
Markets with high trading volume generally have many more buys and sell for any given asset. This results in less price ranging and more liquidity which leads to more profitable trading opportunities.
Markets without enough volume are less appealing since low volume indicates less profitable opportunities due to less volatile prices and the other problems associated with not finding a buyer for your asset fast enough. That is why exchanges with low volume can present liquidity issues.
Usually, volume is interpreted jointly with the shape of the respective candle to figure out which force has more presence in the market, demand or supply. Several trading strategies, such as price, volume and MACD divergences, imply the use of volume in one way or another. Volume is without a doubt a key element that a trader should take into account when it comes to analyzing crypto, stock or forex.
Supports and Resistances
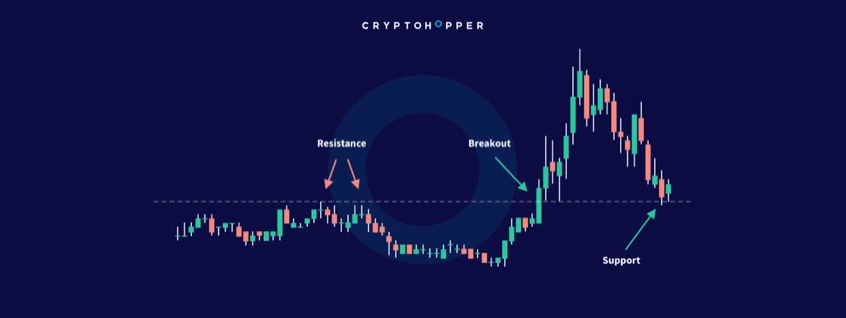
These are arguably the most simple, common and potentially useful “indicators” when analyzing a chart. It basically consists of drawing lines in most recent and important maximums and minimums.
But, how do we know that a certain maximum/minimum is a key one to be considered a resistance or support? Volume here plays an important role. Maximum or minimums that imply higher volume are considered stronger resistances/supports.
They are zones where the price is more likely to stop and in the case of breaking it, make a pull-back and continue its way up or down. Moreover, the number of times that the price bounces against a resistance/support also suggests that the resistance line will be harder to break.
Most of the trading strategies, even though they use multiple technical indicators, take into account short, medium and long-term supports and resistances due to they are key factors determining the future path of the price.
Now, you might wonder what makes these supports and resistances so strong. It might seem difficult and even stupid, but is very simple.
It is because other investors all around the globe think that the price might stop where the price previously did a minimum or maximum, making it bounce on these zones. This is the so-called self-fulfilling prophecy.
Technical Indicators (TIs)
Technical indicators are mathematical operations based on past information of a certain asset displayed along the chart.
This information is mostly about pasts prices and volumes. This helps to predict future prices relying on what happened in the past, in terms of patterns or high volume zones, will happen again.
They can estimate various important things, such as when a price will stop falling in a certain support or that the price will fall after on moving average crosses another one. This is known as self-fulfilling prophecy.
Similar to resistances, traders know that other traders are making these calculations, therefore, the total effect of the predicted decisions, leads to the outcome of their prediction actually coming true. It might sound crazy, but it is the standard process of every trader’s work.
We’ll be learning more about technical indicators in future blogs, so keep reading in the future for a bigger drill-down of each indicator and how traders interact with them.
The Cryptohopper platform offers you a wide range of possibilities to carry out a proper analysis.
Apart from TradingView, within the platform, you can see and analyze charts.
The Cryptohopper automated trading platform also offers several indicators and the possibility to fine-tune them with different values for, for instance, MACD, Bollinger bands, moving averages and more as well as other interesting features such as trailing stop-loss and DCA.
These 6 points are some of the most important factors to understand when it comes to analyzing a chart. Learning the bases of each of them would give you a very good insight into how to study an asset through its chart and design your own strategy!
Ready to start trading with Cryptohopper? Start here


_webp.webp&w=3840&q=75)
_webp.webp&w=3840&q=75)


