By publishing statistics and analysis of market performance, Dow laid a foundation allowing generations of traders and investors to develop increasingly complex and insightful models for predicting the price of assets.
If you missed our Trading 101 article, Technical analysis uses statistics to identify trends in trading activity and provide insight into how the price of an asset might fluctuate in the future.
Learning how to perform technical analysis has become a foundational skill for traders, highlighting significant patterns in the price of assets and providing critical insights into how different assets react under different scenarios.
This article explains how to read basic trading charts, introduces basic indicators to use when conducting technical analysis, and provides helpful advice on how to start implementing trading strategies.
How to use a Trading Chart
One of the first skills a new trader will want to hone is their ability to read trading charts.
Trading charts display helpful information about the price of an asset in a given market, including historical pricing, existing orders, and indicators that help us identify patterns in the price of an asset.
Here’s an example of a BTC/USDT chart as displayed on https://www.binance.us/?ref=35014894:
What’s going on in this chart?
With so many different numbers, bars, lines, and squiggles, it’s completely understandable why it can be difficult for new traders to figure out what’s going on when encountering their first trading chart. Don’t worry! Here’s what you need to know: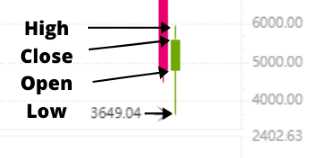
The bars are called candlesticks. Each candlestick represents a specified period of time; in this case, one hour.
The “candle” represents the open and closing price in that period of time while the “wicks” show the high and low prices. Green candles mean the price closed higher than where it started while red candles mean the price went lower.
Trend lines show how prices move in accordance with different indicators. The two trend lines labeled on the chart display the 25-day and 99-day moving average, or the average price over the last 25 and 99 days.
The candlesticks and trend lines form support and resistance as the price fluctuates. Low points form the support while the highest prices define the resistance.
An Introduction to Indicators
Anyone who’s spent time learning about trading and investment has probably heard about “leading,” “lagging,” and perhaps even “coincident” indicators.
An indicator is simply a piece of information that signals something about what’s happening in a market. Most traders use indicators to help decide when to enter and exit their trades.
Moving Average (MA)
As its name suggests, a Moving Average (MA) displays the average or mean price of an asset over a specified period of time.
Simple Moving Averages (SMA) reflect the mean over a number of days (ex. a 30-day moving average reflects the average price of an asset over the last 30 days) while Exponential Moving Averages (EMA) give greater weight to more recent days.
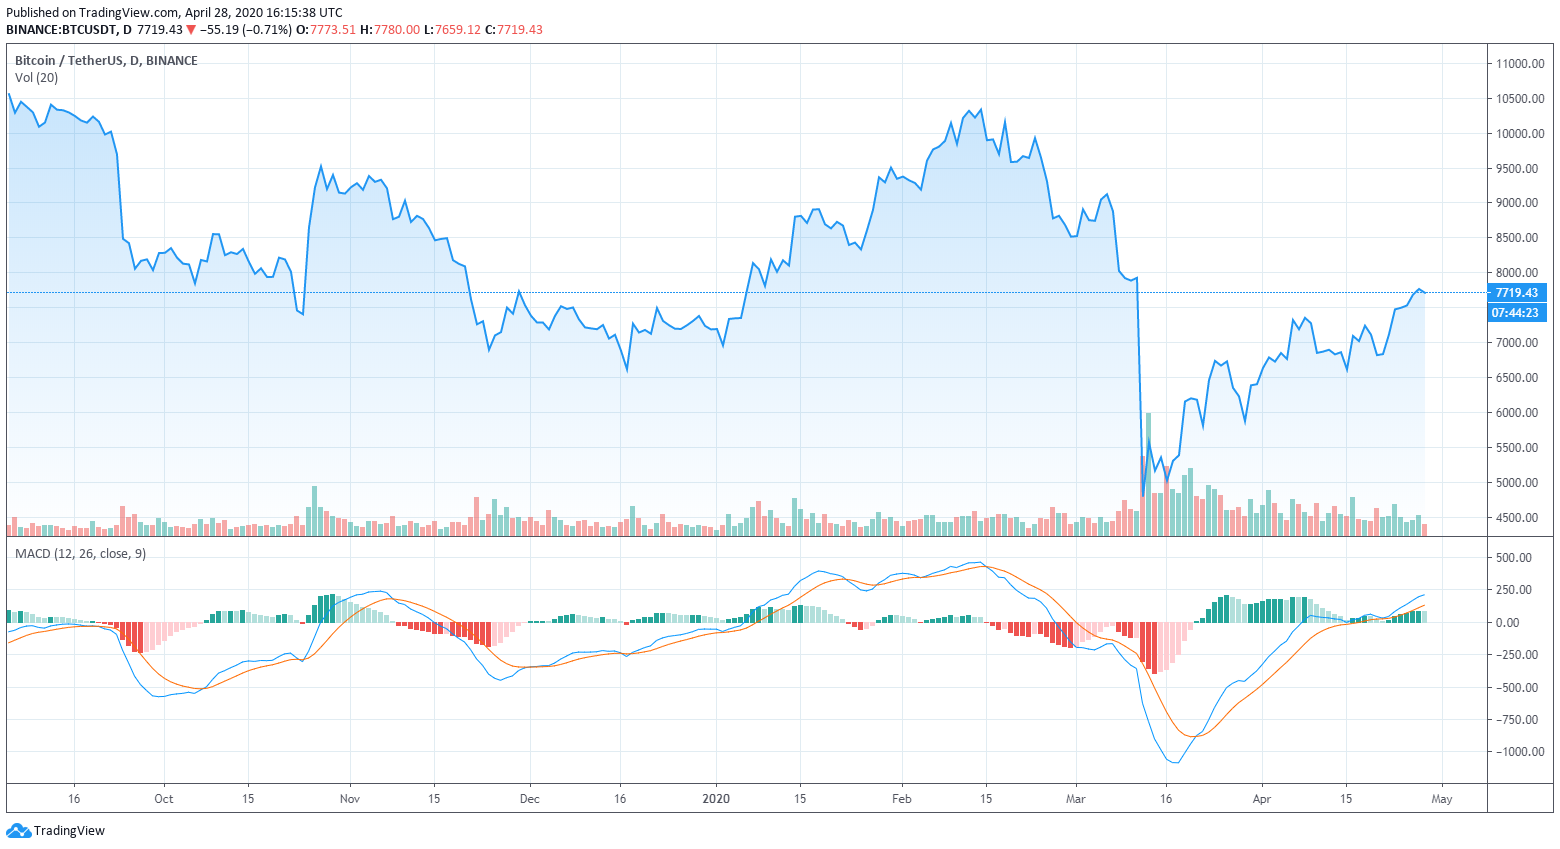
The Moving Average Convergence Divergence (MACD) indicator uses two EMAs to provide insight into the momentum of the market and possible entry and exit points for trading.
If you look at the example in the following chart, the bottom portion includes two lines displaying 12- and 26-day moving averages. Traders look for the lines to cross over each other in a signal line crossover or cross the middle of the chart in a centerline crossover.
A Bollinger Band is another indicator that uses moving averages in the form of an SMA with standard deviations to help show whether an asset may be under- or over-valued.
Relative Strength Index (RSI)
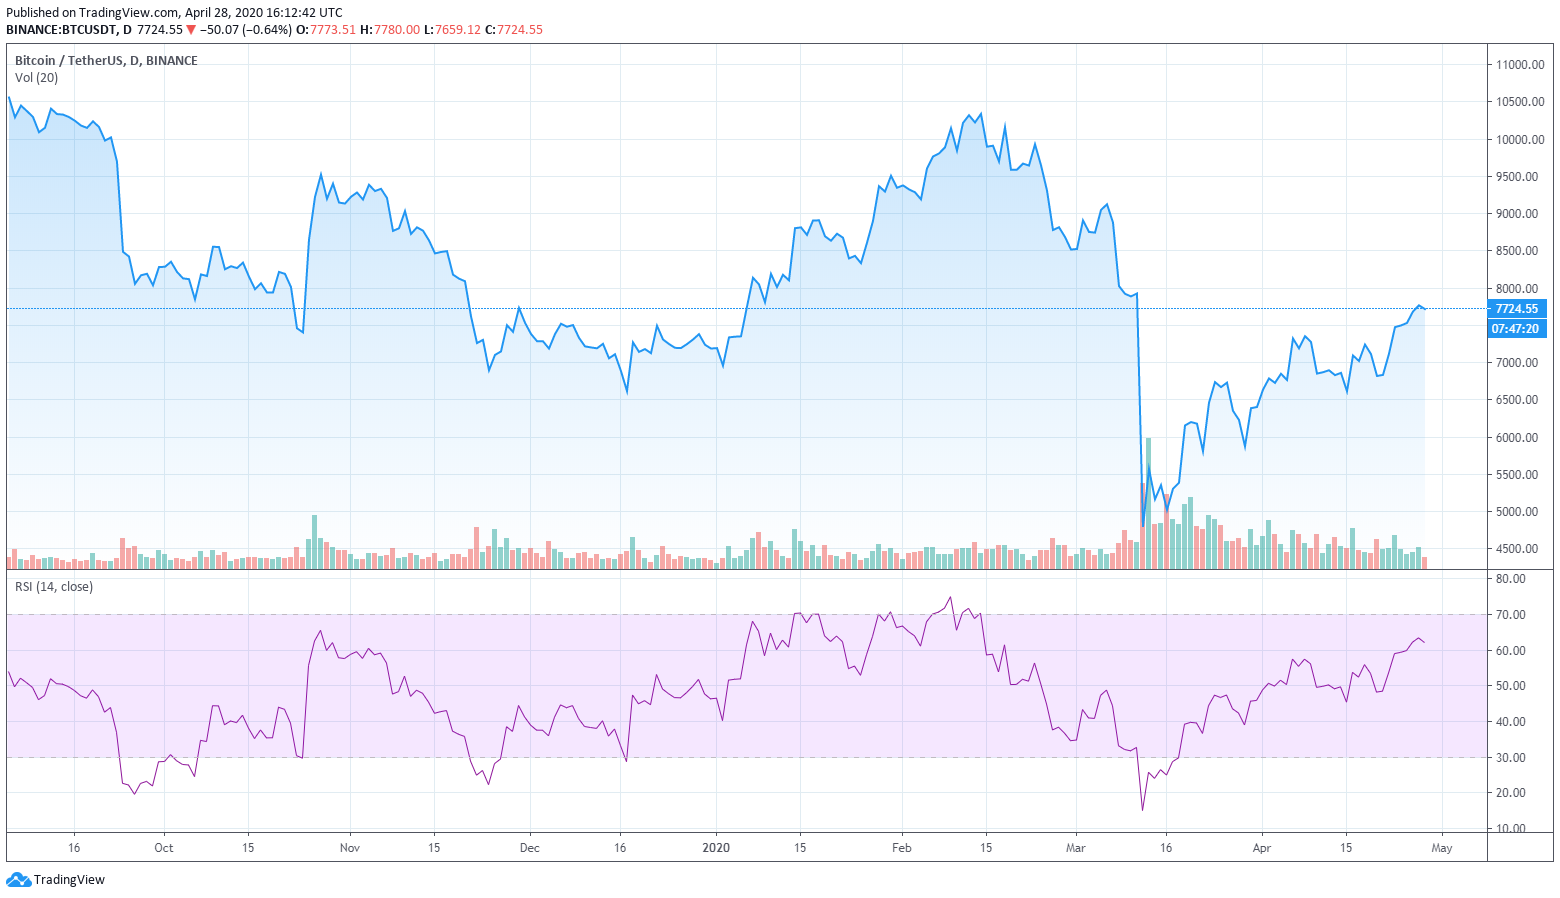
The Relative Strength Index (RSI) also helps traders understand whether or not an asset may be over-bought or over-sold by calculating the average gains and losses over a specified period of time and calculating their momentum.
RSI is displayed as a percentage, with RSI above 70% generally being considered over-bought and under 30% being under-sold. The bottom part of the chart below displays an RSI indicator with the purple area representing the channel between those 30% and 70% benchmarks.
Stochastic Oscillator
A Stochastic Oscillator may sound like an expensive piece of dental equipment but it’s actually a type of indicator that compares a closing price with the range of prices over a period of time.
Stochastic RSI (StochRSI) is a common indicator that applies the Stochastic formula to a RSI indicator to increase the sensitivity of the indicator to a specific asset.
Learn about the 5 Essential Indicators Used in Technical Analysis in Binance Academy
How to Get Started
Learning about different strategies is only half the battle: here’s how to start applying and optimizing different trading strategies:
1. Select a strategy, timeframe, and exchange
The first decision to make is what strategy to use. How can we apply fundamental and technical analysis to gain an edge in going long or short, arbitraging, or perhaps market making an asset?
As an example, let’s say we find a MACD indicator that appears to do a good job of predicting opportunities to go long and short on Bitcoin.
Next, we have to decide how much money to risk on the trade. In our article on Risk Management, we mentioned that a good trader should NEVER risk their entire account on a single trade.
The same goes for trading strategies: it’s never a good idea to risk all of your funds on a single trading strategy.
Finally, you’ll want to decide where to go to execute the strategy. Make sure you have accounts set up with all of the exchanges you may want to use before doing any trading.
2. Execute the strategy
As many traders will relate, removing emotion from the situation and resisting the urge to alter a strategy as it’s being executed can make or break a trader.
Sticking to your trading strategy is a critical part of risk management and enables traders to fully analyze the results of their initial hypothesis, which brings us to step 3:
3. Track and analyze the results
Use the Binance.US Trade Tracker to record total gains or losses, details on the strategy and how it was executed, and reflections on how the strategy might be improved.
Ready to learn more?
Start practicing your T.A. skills and be sure to stay tuned for our upcoming article on Fundamental Analysis to refine your trading strategies even further!
In case you missed the previous articles in our series, be sure to check them all out here in Your Guide to Crypto Literacy!
Ready to learn more?
Stay tuned for our next Education 101 Series! Follow us on Twitter @BinanceUS
Learn Together. Earn Together.
Share Your Guide to Crypto Literacy + your Binance.US referral link with friends.
Start Trading Now!
Download Binance.US app here or scan the QR code below!