
Volume: The foundation of Price Movements
Volume itself is not like other indicators. In its overall form, it doesn’t actually make any form of calculation, nor does it gives buy/sell signals.
What volume does measure is how much of a specific currency, asset or cryptocurrency is traded within a determined period of time. It’s a simple but powerful tool that every trader should take into account.
so...if volume doesn't give a buy or sell signal, why should we use it?
Well, the volume of every asset reveals a lot of important information about the behavior of the price that, if well decoded, can provide us with some great hints of future price directions.
The main things we must bear in mind while studying the volume are the following:
Volume is the fuel for price movements
Traders love volatility.
Volatility moves prices, creating trading opportunities and is usually accompanied with more volume.
Markets with little volatility are considered boring and not profitable, and very possibly more illiquid. Also, when the price is more volatile, it’s also less likely to range, thereby creating more room for trending positions (ie. up or down a certain direction, rather than sideways).
The great volatility in cryptocurrencies is very possibly the factor that has attracted so many investors and has, no doubt, driven their price to very high levels in such a small time frame.
Be warned, volatility is also known to blow up stop-losses too early, leaving traders out of potentially profitable trades while trading a trend.
That's why they are often considered as a double-edged sword.
Areas of Volume
Volume usually repeatedly peaks in the same specific areas over time.
Why?
Well, to some extent, volume has memory.
Price levels with higher historical volume will very usually have an increase in volume once that price level is reached again.
These are called volume areas, and they conform to support and resistances, zones that can act as a magnet for the price, where price might be stopped in it's track upwards up or downwards.
Volume causes volatility
An asset with very low volume can be compared with an encephalogram of a dead man.
No trading activity means a flat line in the chart. In other words, the asset is dead which is a trader’s nightmare.
The volume is the source of life in trading. It produces volatility and therefore profitable opportunities.
Usually, sideways market conditions are qualified as no trade zones. It is when volume peaks, breaking the range and starts trending again when most of the positions are open. We can say that there is a very positive correlation between volume, volatility and trading activity.
The volume sparks a chain of events that work as follows:
↑ Volume ⇨ ↑ Volatility ⇨ Price trending ⇨ ↑ Leverage availability ⇨ ↑ Trading activity ⇨ ↑ Potential profit opportunities.
In Cryptohopper there are 3 indicators that take into account volume in its analyses to give bullish and bearish signals. These are Money Flow Index (MFI), On Balance Volume (OBV) and Chaikin A/D Oscillator.
Money Flow Index
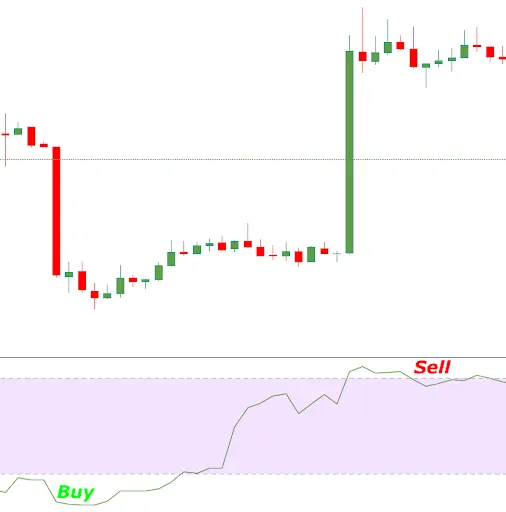
MFI, also known as the volume-weighted R.S.I., it combines volume and price to analyze overbought and oversold zones.
It is similar to RSI, but incorporating positive and negative money flow volumes to create an oscillator that ranges from zero and one hundred.
In comparison with the RSI, we can say that, since MFI adds volume to its analysis, it is more volatile and will give more buy and sell signals.
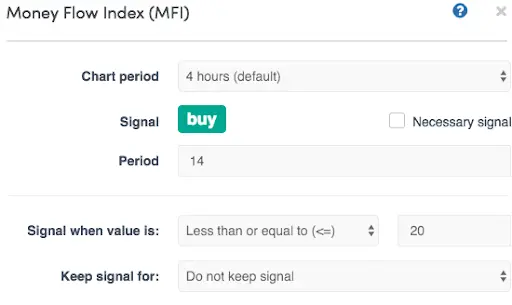
You can automate this indicator and combine it with other ones in the Strategy designer.
Hesitant about the performance of your strategy? No worries! You can test it with our backtester.
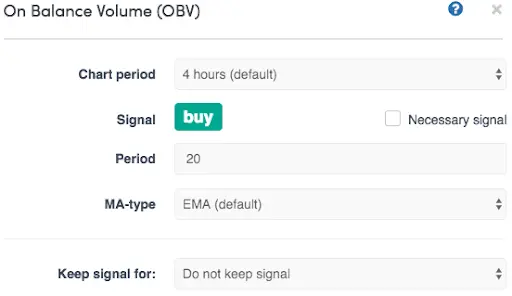
On Balance Volume
The OBV is a cumulative momentum and volume indicator, which measures positive and negative volume flows.
It looks at the prices of a coin at the close. If the close is at a level above that of the previous day, the volume will be added. Alternatively, the volume is subtracted when the closing price is below that of the previous day.
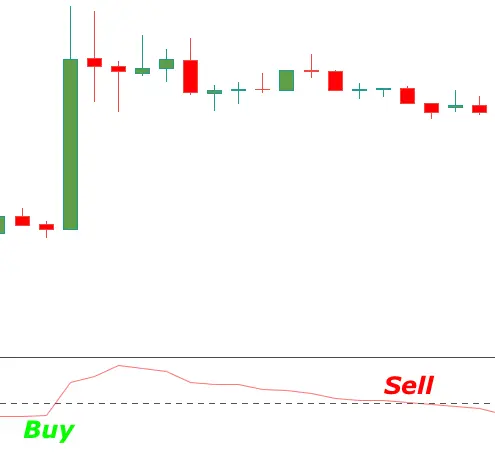
This volume indicator is used to predict price movements and confirm price trends. In order to give buy and sell signals, Cryptohopper added a moving average of the OBV level for a configurable amount of periods.
Then, every time that the OBV level increases, meaning that the volume and price of a coin are going up together, the OBV line will cross upwards its moving average, therefore making a bullish crossover and giving a Buy signal. On the other hand, a Sell signal will be given every time that the OBV line is above its moving average.
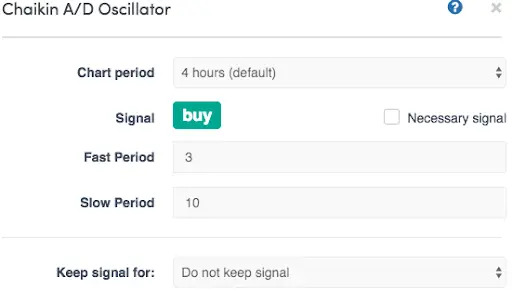
Chaikin A/D Oscillator
Chaikin oscillator is a momentum indicator that adds volume to its analysis. It is an indicator of an indicator since it subtracts the 3-day EMA from the 10-day EMA (default values) of the Accumulation/Distribution (A/D) line.
The A/D line is a variant of the previously mentioned and more used OBV. If this line goes up, it means that there is accumulation (buys) in that specific coin, and therefore the volume is growing. However, when it decreases it is considered distribution (sells), meaning that price and volume go down.
The Chaikin A/D Oscillator will give a buy signal when its level crosses upwards the 0 line, which suggests that price and volume are increasing.
On the other hand, if it crosses downwards the 0 line, the hopper will give a sell signal since price and volume are decreasing.
As said at the beginning of the article, volume is one of the most used parameters when it comes to analyzing a chart. It is used in a wide variety of trading styles.
From naked trading (trading without technical indicators) to automated trading. From one-minute candles to daily ones. From scalpers to position traders.
Want to get started with volume indicators? Click here


_webp.webp&w=1920&q=75)
_webp.webp&w=1920&q=75)