One of the main characteristics of a trading environment is the dynamic movement of the traded assets, which is typically represented by charts. As we learned in the previous content on the common types of charts used in crypto trading, trading charts contain invaluable information about the market. Hence, it’s crucial to know how to interpret them.
Two persons may be looking at the same chart, but only a trader knows what it means and what needs to be done.
On Bitfinex Trading 101 Chart Pattern series, we will cover various chart patterns, how to identify them, and what they may indicate. For a start, we will talk about the Triangle chart patterns.
A triangle chart pattern is established when an asset’s market price moves into a tighter range over time. It is formed by drawing two straight lines—one line connects the high prices, the other connects the low prices—that converge in the end.
Triangle is one of the most commonly used chart patterns, and it’s pretty popular among day traders. They’re crucial for some reasons, such as highlighting diminishing volatility that may indicate specific scenarios of a forthcoming price movement and providing trading opportunities along the way as it’s taking place.
Triangle chart patterns can signal either a trend continuation or reversal, depending on the breakout that follows. Hence, it’s critical for traders to pay attention to this before taking any actions.
There are three types of triangle patterns according to the shape:
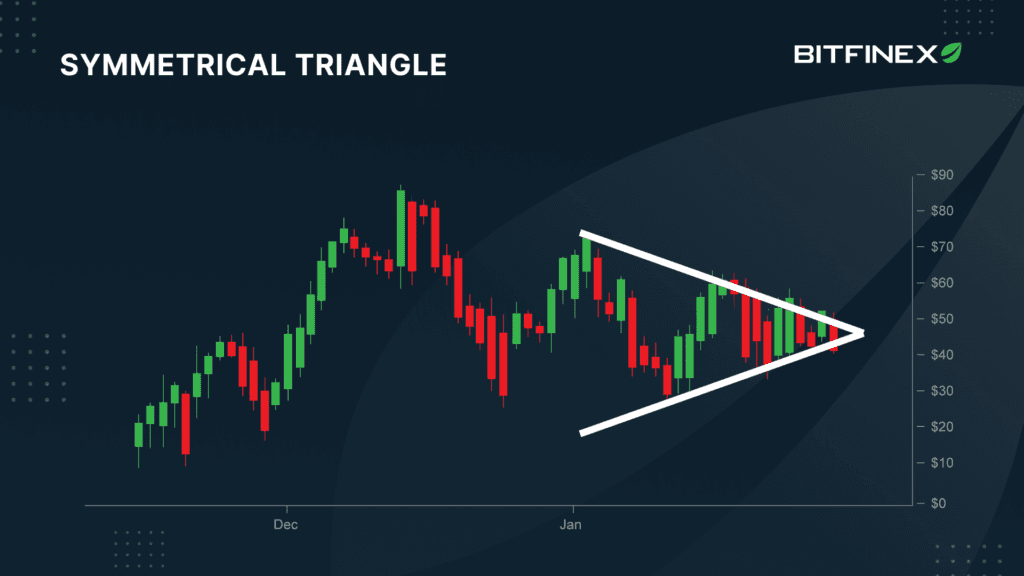
Symmetrical triangle
A symmetrical triangle pattern is formed by a series of higher lows and lower highs. It is neither bullish nor bearish as it doesn’t show a particular direction in its movement.
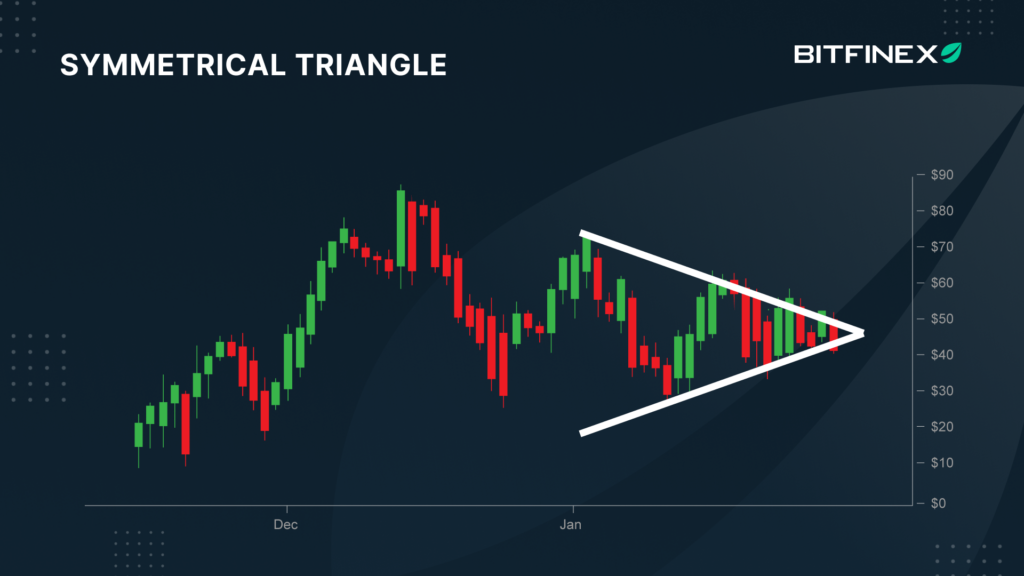
That said, the pattern could hint at which direction the price will go, depending on the breakout. An upward breakout is a bullish signal, meaning the price will go up, whereas a downward breakout is a bearish signal, meaning the price will go down.
Ascending triangle
An ascending triangle pattern is formed by a resistance line and a slope of higher lows. This pattern indicates the buying pressure is stronger than the selling pressure and is considered a bullish formation, in general.
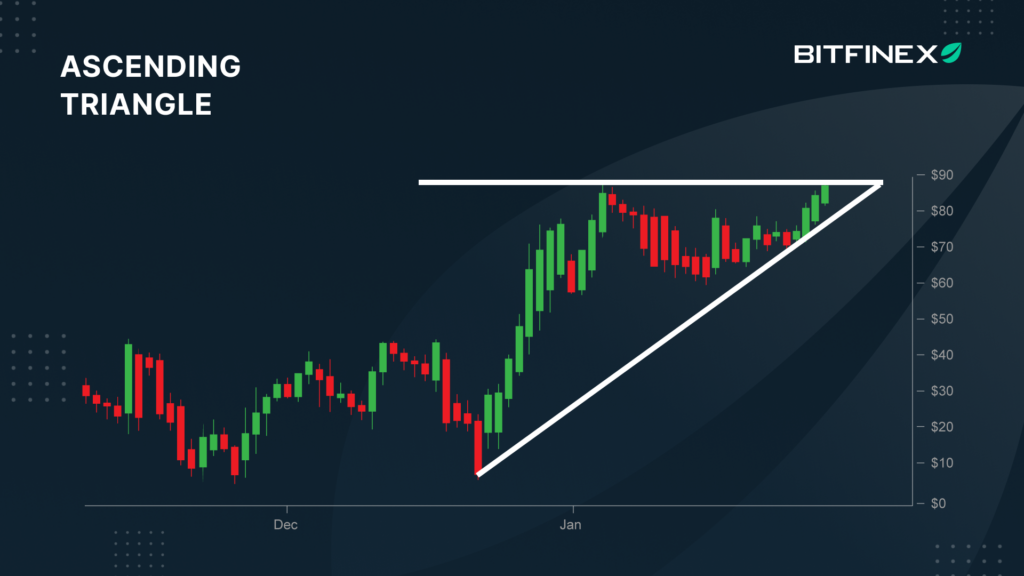
When the ascending pattern is established in an uptrend, it signals a trend continuation. On the other hand, when the pattern is established in a downtrend, it signals a trend reversal.
Descending triangle
A descending triangle pattern is formed by a series of lower highs and a support line. This pattern indicates the selling pressure is stronger than the buying pressure and is considered a bearish formation, in general.
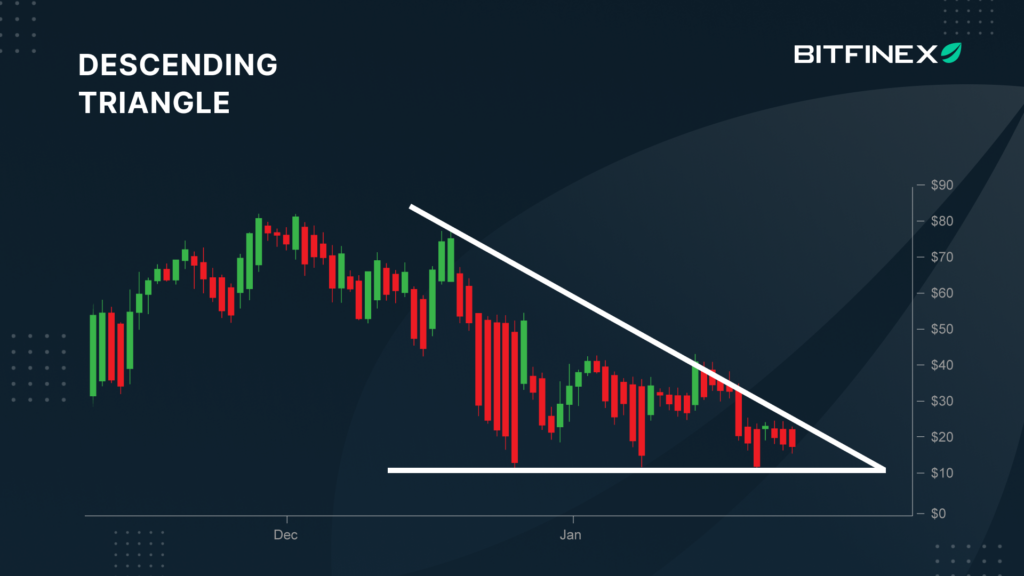
When the descending pattern is established in an uptrend, it signals a trend reversal and a trend continuation when established in a downtrend.
In the next Bitfinex Trading 101 blog series, we will talk about the Wedge chart patterns. Make sure to subscribe to Bitfinex newsletter so you won’t miss out on our educational content. You can also follow Bitfinex YouTube channel for educational content in video format.
The post appeared first on Bitfinex blog.


