Welcome back to the Chart Decoder Series, where we turn complex trading tools into actionable strategies.
Our journey so far:
- SMA vs EMA for trend direction
- MACD for momentum shifts
- RSI for overbought/oversold zones
- Bollinger Bands for volatility and price extremes
- Stochastic Oscillator for timing reversals
- VWAP for fair price detection
- Volume + OBV for spotting smart money flow
- ATR for volatility-based risk management
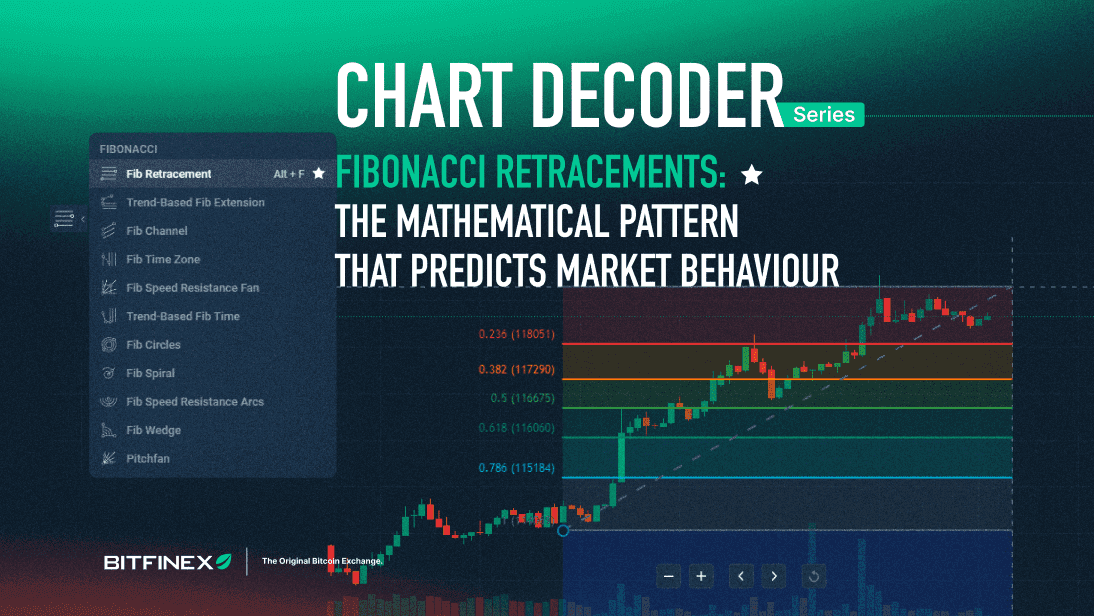
Today, we’re exploring Fibonacci retracements, the mathematical tool that reveals where markets are most likely to find support and resistance.
The Mathematical Foundation
The Fibonacci sequence is a simple pattern where each number is the sum of the two before it (1, 1, 2, 3, 5, 8, 13…). What makes it fascinating is the ratio between these numbers. As the sequence grows, the ratio stabilises around 1.618, also known as the Golden Ratio.
This ratio shows up everywhere in the natural world:
- The spiral of seashells and galaxies
- The way leaves grow around a stem
- The proportions of the human body
- The branching of trees and rivers
In trading, we convert these mathematical relationships into retracement percentages. The key Fibonacci ratios are derived from the Golden Ratio (1.618):
- 61.8% = 1 ÷ 1.618 (the inverse of the Golden Ratio)
- 38.2% = 1 – 61.8%
- 23.6% = 38.2% × 61.8%
- 78.6% = the square root of 61.8%
Why this matters for trading:
These aren’t arbitrary numbers – they’re mathematical relationships that appear throughout nature. When applied to price movements, they often mark where buying and selling pressure naturally shifts.
- 61.8%: The golden ratio. The most powerful retracement, where major bounces often happen. Institutional traders monitor this level closely as it represents the mathematical “decision point” for trend continuation.
- 38.2%: A common correction level where price temporarily pauses before resuming the primary trend.
- 23.6%: Indicates strong underlying momentum. Robust trends rarely retrace beyond this level before continuing.
- 78.6%: Represents the “last stand” for trend continuation. Breaks below this level typically signal impending trend reversal.
Setting Up Fibonacci Retracement on Bitfinex
Fibonacci retracements identify potential reversal levels during market corrections. Here’s the process:
- Identify the trend:
- Open trading.bitfinex.com and select your trading pair.
- On the left toolbar, look for the “Fib Retracement” tool (it looks like 4 horizontal lines)
- Spot a clear move on the chart – either a rally (low to high) or a drop (high to low).
- Find your swing points:
- Swing Low: The obvious lowest point where price bottomed out before moving up
- Swing High: The obvious highest point where price peaked before moving down
- Tip: Zoom out to see the bigger picture – you want the most obvious turning points, not small bumps
- Apply the tool:
- Uptrend: Click the swing low, drag to the swing high
- Downtrend: Click the swing high, drag to the swing low
Watch the levels: The tool automatically plots retracement lines (23.6%, 38.2%, 50%, 61.8%, 78.6%). These act as potential support and resistance zones.
Plan your trades: Traders use these levels to time entries, set profit targets, and place stop losses.
The psychology behind it: Markets move in waves due to human emotions, fear and greed create predictable patterns, and Fibonacci levels often line up with where traders collectively step in or take profit.
Real Example: BTC/USD Analysis
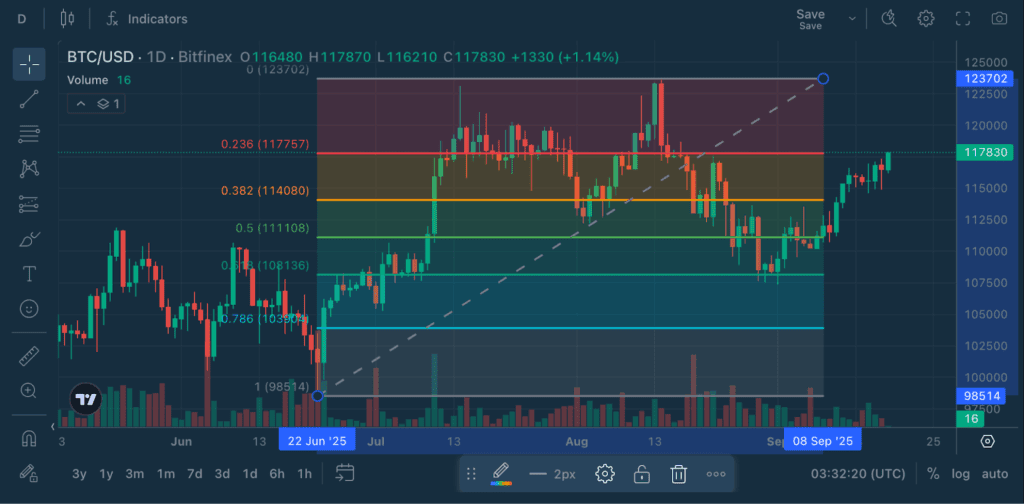
- Swing low: $98,514 (22 Jun)
- Swing high: $123,702 (8 Sep)
- Range: ~$25,188
Calculated retracements:
- 23.6% – $117,757
- 38.2% – $114,080
- 50% – $111,108
- 61.8% – $108,136
- 78.6% – $103,904
Current price: $117,830
Notice how BTC retraced deeply from its September high, testing the critical 61.8% “Golden Ratio” level around $108,136. This demonstrates the power of Fibonacci retracements – the 61.8% level acted as strong support and generated a significant bounce. This is classic Fibonacci behavior where the Golden Ratio level provides a high-probability reversal zone, allowing the trend to continue after testing this mathematically significant support level.
Advanced Fibonacci Strategies
1. Multiple Timeframe Analysis
Apply Fibonacci on different timeframes for confluence:
- Daily chart: Major swing points for position trading
- 4-hour chart: Intermediate levels for swing trading
- 1-hour chart: Fine-tune entries for day trading
2. Fibonacci Confluence Zones
The most powerful setups occur when multiple factors align:
- Fibonacci level + horizontal support/resistance
- Fibonacci level + moving average
- Fibonacci level + trend line
- Multiple Fibonacci levels from different swings
3. Extension Projections
Once price breaks past the previous high or low, Fibonacci isn’t just about pullbacks, it can also project where the move might go next. Traders often watch:
- 100% – Equal to the last swing.
- 127.2% – First extension target.
- 161.8% – The “golden target,” where many trends pause.
- 200%+ – Aggressive moves in strong trends.
4. Fibonacci + Other Indicators
- Fibonacci + RSI**:**RSI oversold at key Fib level = high-probability bounce. For example, RSI below 30 at 61.8% retracement often marks significant lows. Wait for RSI to turn up from oversold at Fib support
- Fibonacci + ATRUse ATR to set stops beyond Fibonacci levels. For example, If 61.8% level is $96,460 and ATR is $3,000, place stop at $93,460. ATR ensures your stop accounts for normal volatility
- Fibonacci + VolumeHigh volume at Fib levels confirms significance. For example, Volume spike + bounce at 61.8% = strong reversal signal. High volume break of 78.6% suggests trend change
- Fibonacci + MACDMACD divergence at Fibonacci levels creates powerful reversal setups. Your entry trigger comes when the MACD line crosses above its signal line while price holds Fibonacci support.
Bonus Read: Fibonacci + RSI in Action
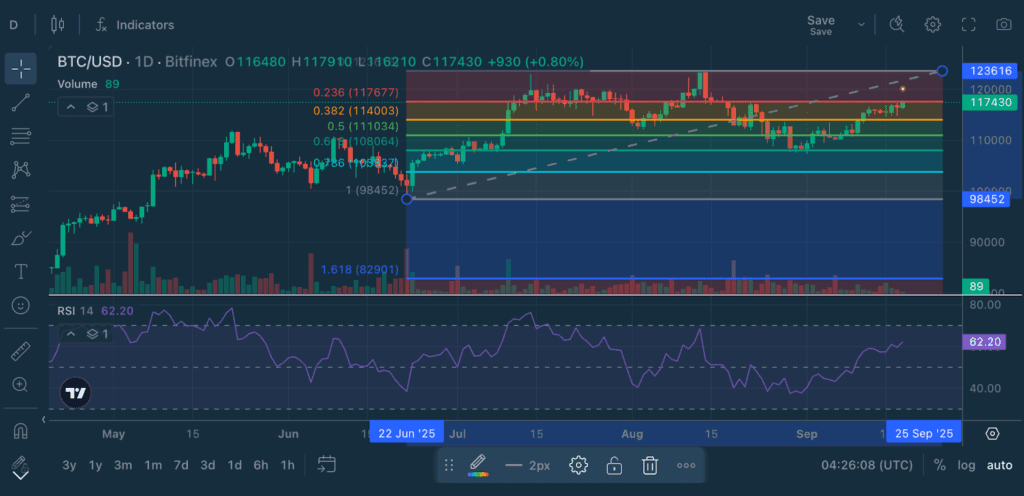
Looking at this BTC daily chart, we can see the 61.8% “Golden Ratio” level at $108,064 acting as major support. When BTC retraced from its highs down to this critical Fibonacci level, it found strong buying interest and bounced significantly.
BTC rallied from this mathematical support level back above $117,000, demonstrating how the 61.8% retracement often marks important turning points. The current RSI reading of 62.20 shows healthy momentum has returned after the recovery.
The next key level to watch is the 23.6% retracement at $117,677. A break above with rising RSI could signal continuation toward new highs. However, if RSI starts diverging negatively while price struggles at this level, it might indicate another test of deeper Fibonacci support is coming.
Common Fibonacci Mistakes to Avoid
Swing Point Slip-UpsDon’t use tiny highs and lows. They give messy signals. Stick to clear, obvious swing points that show up on multiple timeframes.
Fighting the TrendOne Fib line won’t overturn the bigger picture. Always trade in the direction of the larger trend, not against it.
Jumping In Too FastDon’t buy the second price touches a level. Wait for confirmation: candlestick patterns, volume, or momentum indicators.
Trusting Fibs BlindlyNot every level holds. Use stops and look for confluence with moving averages or other Fibonacci levels.
Ignoring ContextConsider news, economic data, and market sentiment alongside your Fibonacci analysis.
Fibonacci Limitations
Subjectivity: Different analysts may select varying swing points, leading to slightly different level calculations.
Market Conditions: Fibonacci analysis performs optimally in trending markets but may provide false signals during choppy, sideways price action.
Historical Basis: These tools analyse past price movements rather than predict future price action with certainty.
False Signals: Market conditions can change rapidly, causing price to break through expected support or resistance levels.
The post appeared first on Bitfinex blog.