Crypto trading 101: What are Moving Averages (MA)
In the crypto market, a moving average is a technical analysis tool traders can use to determine if a particular investment has enough momentum to keep going. The article will discuss six of the most popular types of averages.
What Is a Moving Average (MA)?
A moving average (MA) is a technical indicator that calculates the average price of a security over a specific period of time.
The most common time periods used are 15, 20, 30, 50, 100, and 200 days.
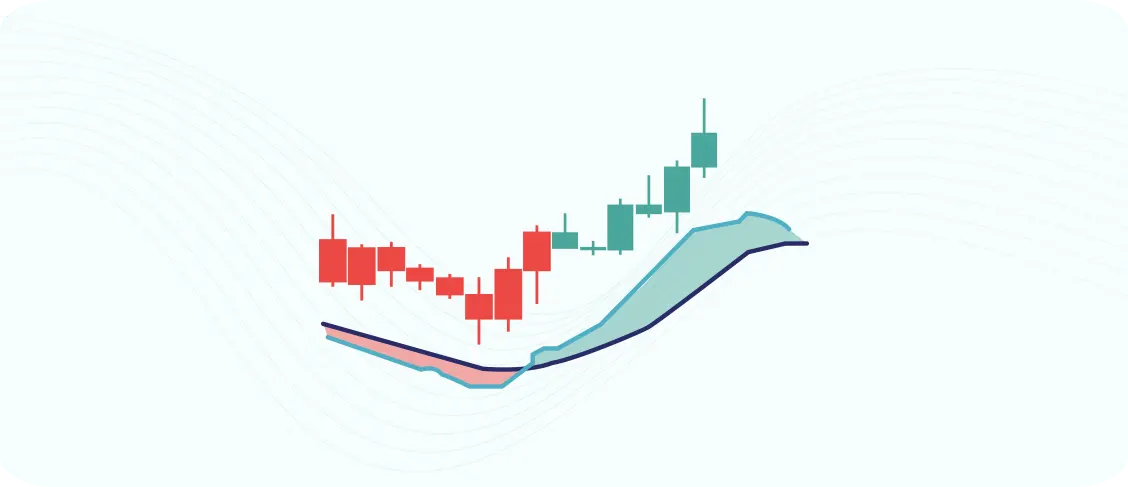
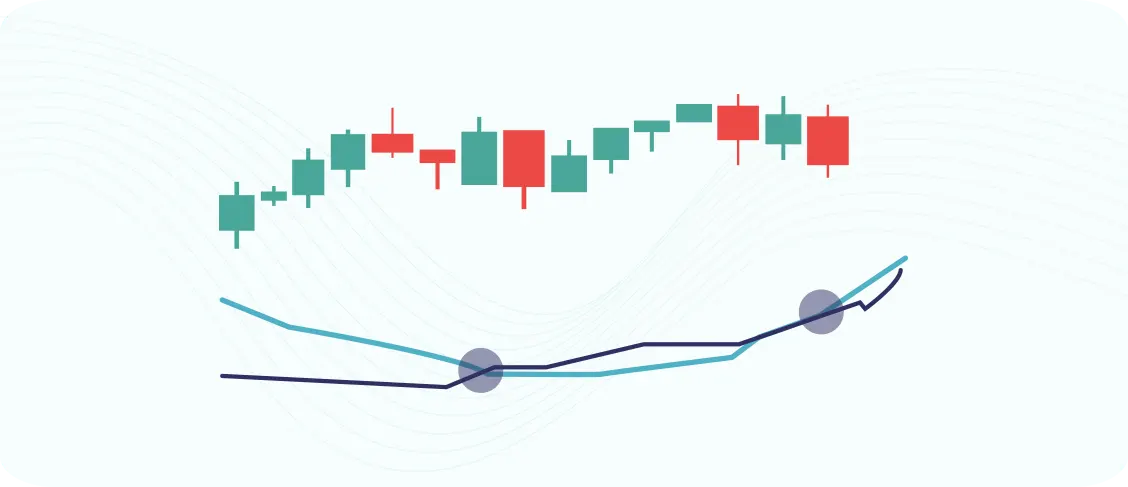
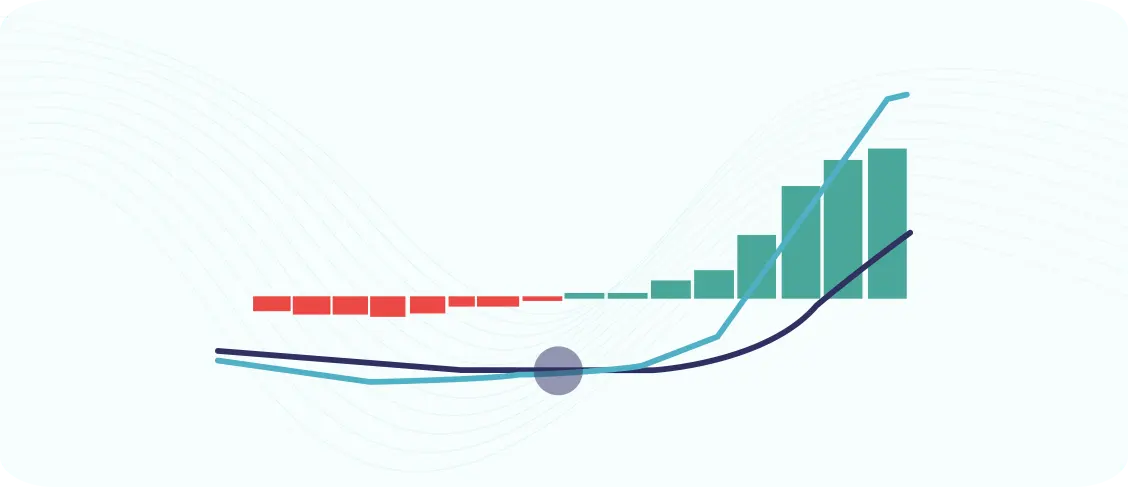
MAs help smooth out the volatility in prices by creating a consistent trend line. This makes it easier for traders to identify potential buying or selling opportunities.
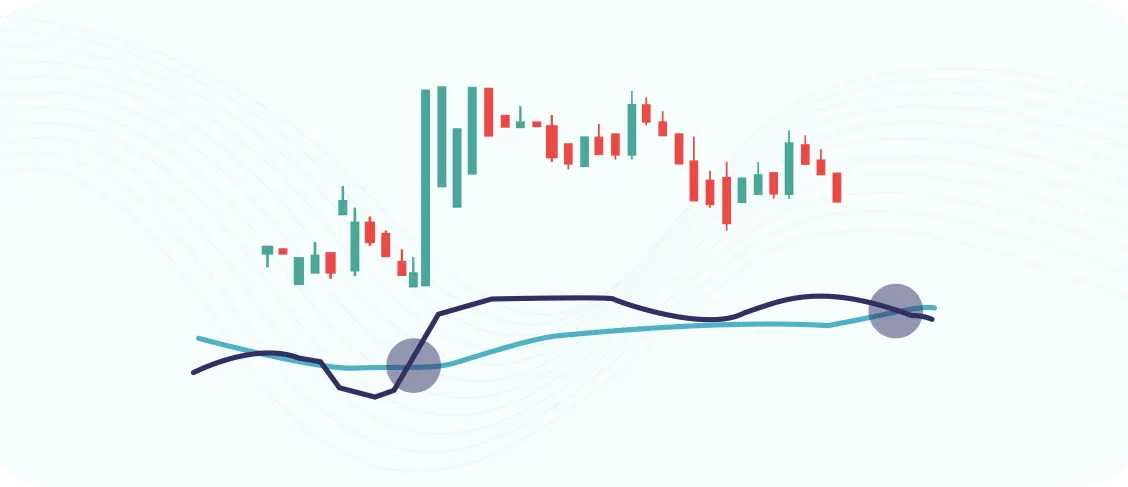
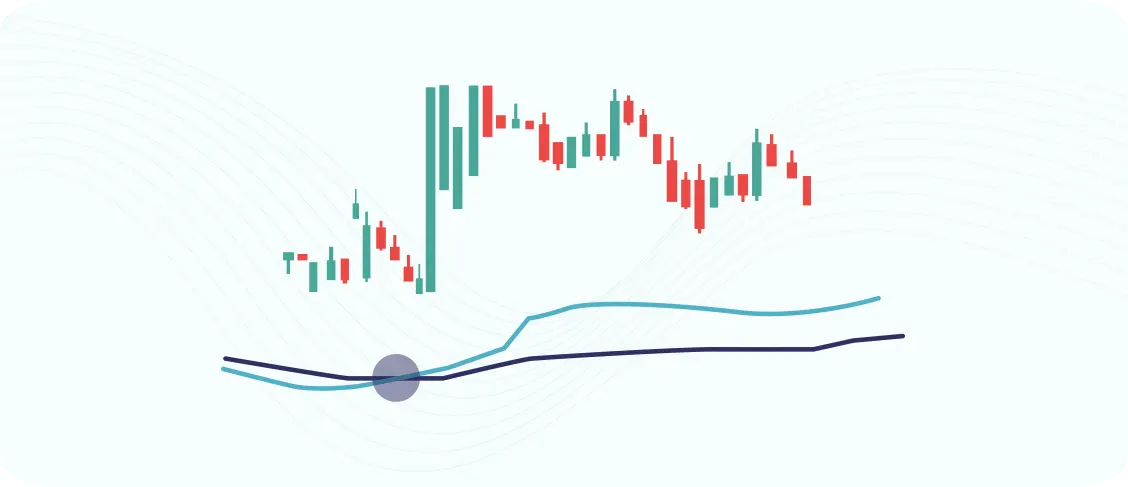
MAs can also be used to generate buy and sell signals. For example, if the 50-day MA crosses above the 200-day MA, then it’s seen as a bullish signal, and vice versa.
How important is it to use Moving Averages?
Moving averages can be very important! MAs help to smooth out price action, and can give you a good idea of the overall trend. They can also help you to spot potential support and resistance levels.
If you are just starting out, it’s a good idea to use simple moving averages. These are easy to calculate and understand. Once you get more experience, you may want to try using Exponential Moving Averages (EMA). These place more weight on recent data, which can be helpful in certain situations.
Six Types of moving averages
Simple Moving Averages (SMA)
The Simple Moving Average (SMA) is a trend indicator commonly used for trading.
It smooths price movements and helps identify trends in the market over a period of time. The crossover of two moving averages can help traders find support and resistance points that are more accurate than just using one average alone.
Exponential Moving Averages (EMA)

An EMA is a trend indicator that responds more quickly to price differences. It weighs recent prices higher than the Simple Moving Average, which means that the most recent data will make up a greater extent the price trend.
This information can be used by traders to create buy and sell signals, like the SMA. When the fast moving average crosses the slow one upwards, this can signal to traders that a bullish trend is starting.
Double Exponential Moving Averages (DEMA)
The Double Exponential Moving Average (DEMA) is a faster trend indicator than the SMA.
It's faster because it reacts to changes in the price more quickly, and by reducing the lag time between prices. The DEMA is even faster than the EMA. This can be useful if you want to trade when prices are moving a lot, and quickly.
Like other technical indicators that measure trends, when the fast line crosses over the slow one upwards, it often signals that a bullish trend is coming.
Mesa Adaptive Moving Average (MESA)
The MESA Adaptive Moving Average (MESA) is a trend-following indicator.
It adapts to price movements in a very unique way based on the Rate of Change (ROC), as measured by the Hilbert Transform Discriminator.
Like other moving averages, traders use this indicator to spot trends and trend reversals. This is done by crossovers between a fast and a slow moving average.
When the fast moving average crosses the slow one upwards, a buy signal will be generated, and it will hold this signal until it reaches an opposite bearish crossover.
Kaufman's Adaptive Moving Average (KAMA)
Developed by Perry Kaufman, the Kaufman's Adaptive Moving Average (KAMA) is an indicator that identifies trends by smoothing out all of the noise when prices fluctuate.
In order to account for volatility in the market, KAMA introduces a so-called efficiency ratio.
This factor reduces fluctuations on the moving average when volatility is peaking. In other words, it will give less importance to trends with very high volatility. This indicator is commonly used to spot trends and trend reversals. As with other moving averages, buy and sell signals are generated through breakouts from trading ranges.
MACD (which is considered a mix of a trend and momentum indicator)
The Moving Average Convergence Divergence (MACD) indicator was created in the late seventies by Gerald Appel.
The indicator is a combination of trend and momentum, and oscillates around a zero line. The zero line separates bearish and bullish sentiment.
When the MACD is in positive territory, the price is bullish, and when it's negative, the bears are leading the market.
Cryptohopper uses a wide variety of technical indicators to help users trade cryptocurrency more effectively. Technical analysis is vital in any kind of trading, and cryptocurrency is no different. The use of indicators can help traders find entry and exit points, as well as manage risk more effectively.


_webp.webp&w=3840&q=75)
_webp.webp&w=3840&q=75)


