Welcome back to the Chart Decoder Series, where we break down the world of technical analysis into tools you’ll actually use.
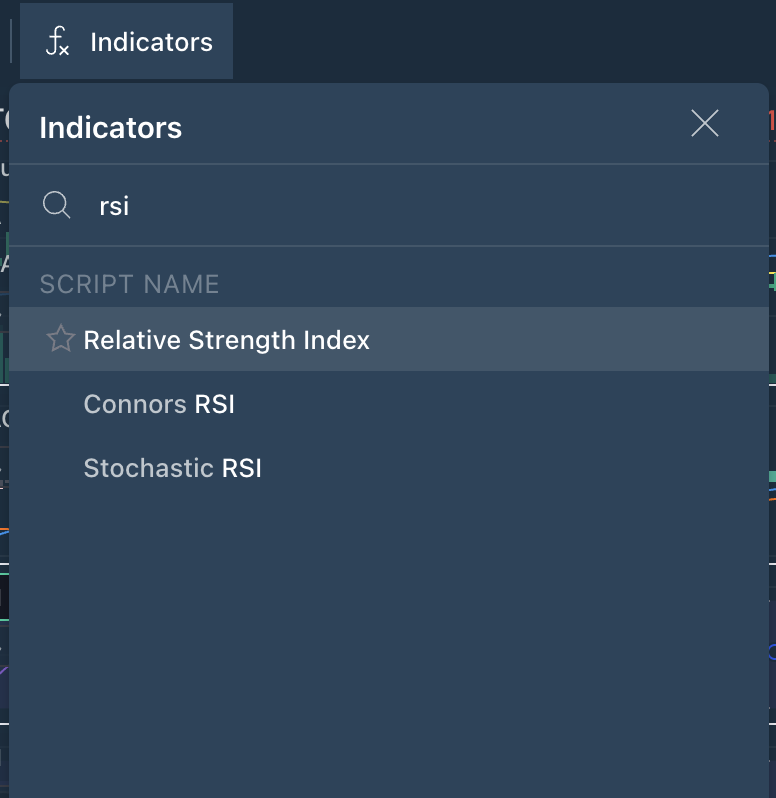
In our previous entries, we covered moving averages and MACD, great for identifying trends and momentum. Now let’s look at RSI, a tool many traders use to time their trades with better confidence.
What is RSI?
RSI stands for Relative Strength Index. It helps you see if a coin has been bought or sold too much recently and might be ready to reverse.
It’s plotted as a line that moves between 0 and 100. Most traders use it with a 14-period setting. Depending on your chart’s timeframe, this could mean 14 days, 14 hours, or even 14 minutes.
Unlike price-following indicators, RSI doesn’t just track where price is. It tells you how extreme recent buying or selling pressure has been. That way, you can figure out if the market’s about to flip before it actually does.
How to Read It:
- RSI above 70 = Overbought → Market may be due for a correction
- RSI below 30 = Oversold → Market may be due for a bounce
- RSI between 40–60 = Neutral → No strong signal
Example in Action:
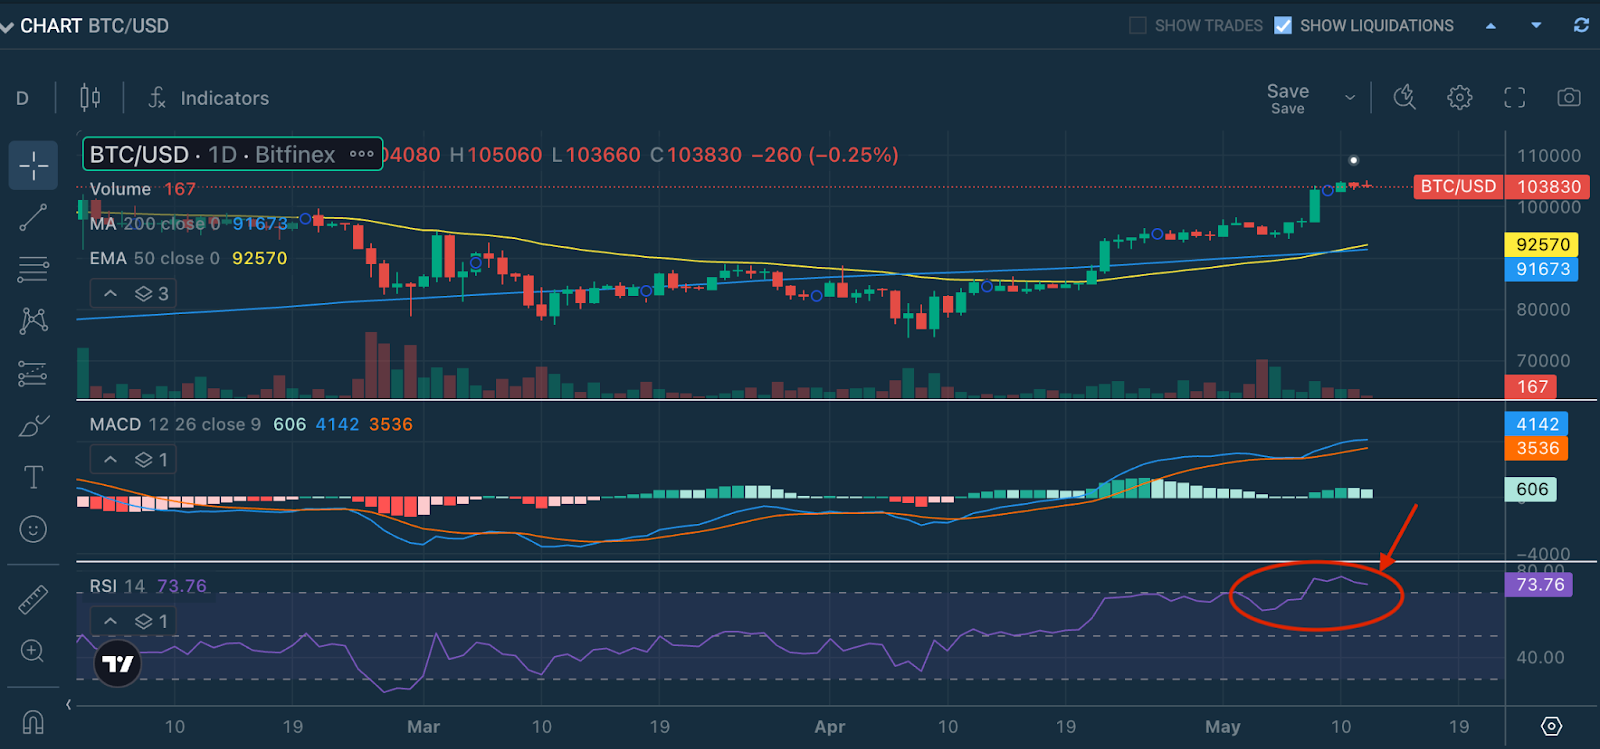
RSI (Purple Panel): Overbought Alert
- RSI is sitting above 70, signalling classic overbought conditions.
- This suggests that Bitcoin’s recent bullish run may be losing steam or approaching a natural correction.
What Traders Are Watching:
- RSI dropping back below 70 could mean a pullback is starting.
- If BTC remains strong, RSI might stay overbought. This is a behavior common in strong uptrends but also a risky zone for late buyers.
For better accuracy, use RSI together with MACD and Moving Averages to make more informed decisions.
MACD: Bullish, but Momentum Slowing?
- MACD Line (Blue): 4,142
- Signal Line (Orange): 3,536
- Histogram: Positive but starting to flatten, hinting that momentum is slowing down.
The MACD remains bullish with the blue line comfortably above the orange, but keep an eye on that histogram. If those bars start to shrink, it’s often the first clue that bullish momentum is fading.
Moving Averages: Is BTC Overextended?
- 50-Day EMA (Yellow Line): 92,570
- 200-Day SMA (Blue Line): 91,673
BTC is trading well above both these critical moving averages, which confirms the strength of the current uptrend.
But this also raises a flag: Is the market overstretched?
When price pulls too far away from these averages, a healthy correction often follows, bringing price back toward the 50 EMA, a level many traders view as dynamic support in a bull market.
Final Takeaways: Should You Act Now or Wait?
- Current Trend: Strongly bullish but potentially overextended.
- RSI: In overbought territory, exercise caution.
- MACD: Still bullish, but showing early signs of slowing momentum.
- Strategy:
- If you’re already in profit, this is a great time to consider securing gains or tightening your stop-losses.
- If you’re waiting to enter, watch for a pullback toward the 50 EMA for a stronger, lower-risk entry point.
Pro Tips for Using RSI Like a Pro
RSI is simple, but using it well is where it really counts. Here’s how experienced traders make the best of RSI:
Understand Market Context
RSI works beautifully in sideways or ranging markets, where price bounces between support and resistance. But in strong trends (like a bull run), RSI can stay overbought or oversold for weeks. So don’t hit that sell button just because RSI hits 70. Look at the bigger picture first.Combine It with Other Indicators
RSI works best when it’s part of the conversation. Try pairing it with:- MACD to check if momentum agrees with what RSI is telling you.
- Moving Averages (like the 50 EMA) to see if price is stretched too far from key support levels.
Watch for Divergence
If price makes a new high, but RSI doesn’t? That’s called bearish divergence, momentum could be slipping.
If price makes a new low, but RSI doesn’t? That’s bullish divergence, a bounce might be around the corner.
Divergence doesn’t always play out immediately, but it’s one of those clues that serious traders don’t ignoreRSI Is an Early Indicator, Not a Direct Call to Action
Just because RSI is flashing overbought or oversold doesn’t mean you need to rush into action. Use it as an early warning, not as a reason to panic-buy or panic-sell.
Play with Timeframes to Refine Your Strategy
RSI readings change based on the timeframe you’re looking at. If the daily RSI shows overbought, but the 1-hour RSI is cooling off, this often means the market is in a short-term pullback within a larger uptrend. Smart traders use this to their advantage, waiting for the short-term RSI to reset before jumping back into the larger trend. This approach helps you avoid chasing tops and gives you better, lower-risk entry points. Always check multiple timeframes before making your move.
Coming soon in Chart Decoder Series: Bollinger Bands – How to Trade Volatility Like a Pro
Bitfinex. The Original Bitcoin Exchange.
The post appeared first on Bitfinex blog.