0%
Shiba Inu Inverse Head and Shoulder Pattern Calls for a Rally
#Bull market#technical indicators#support and resistance+2 weitere Tags

Shiba Inu Inverse Head and Shoulder Pattern Calls for a Rally

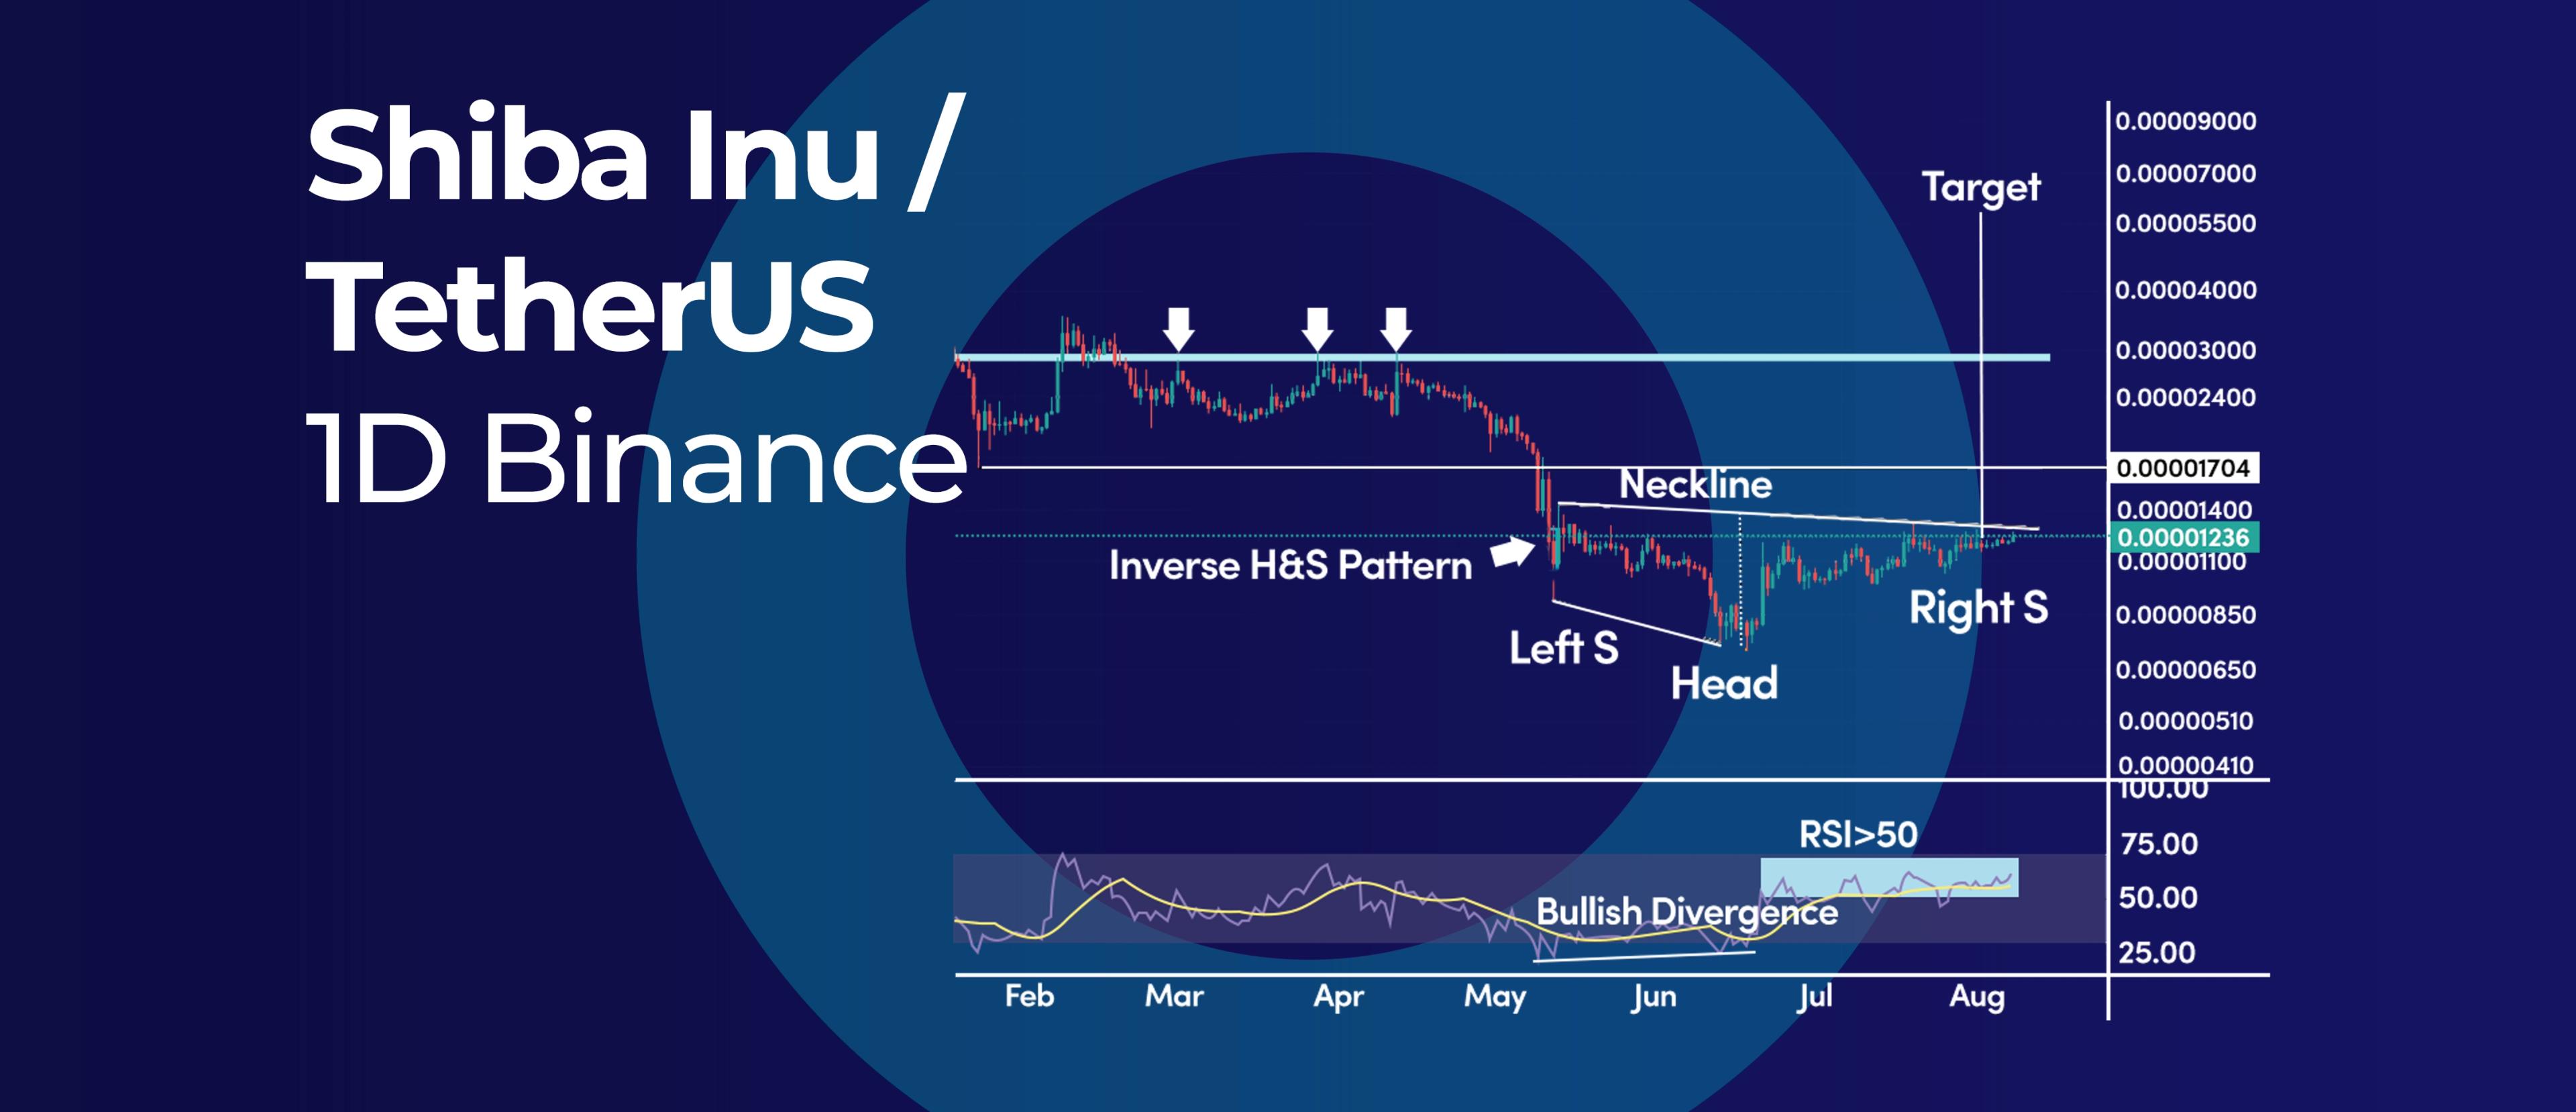
Shiba Inu’s (SHIB) daily chart depicts an almost perfect inverse head and shoulder pattern that calls for a rally towards $0.000025. Additionally, the daily RSI oscillator seems to be building momentum as most RSI readings are above the 50 mid-level.

Inverse Head and Shoulder Pattern

The left shoulder ended with the $0.000009 swing low, and down from there, the head finished at $0.0000071. The right shoulder can be called completed at the $0.000010 low.

Currently, the SHIB price is flirting with the neckline, while a break above will confirm the inverse head and shoulder pattern.

There is also a bullish divergence between the left shoulder and the head, adding more confluence to the bullish case scenario.

If the bullish scenario materializes, the standard target of the Head and Shoulder pattern is the price distance between the head and the neckline added to the breakout point. At the time being, the Head and Shoulder projected target falls at the $0.000025 level.

What is a Inverse Head and Shoulder Pattern?

A Inverse Head and Shoulder Pattern is a technical indicator that is used to identify potential reversals in a security's price.

The pattern is created when the security's price forms two lower highs and a higher low. This creates a "head and shoulders" appearance on the security's price chart.

The neckline is created by connecting the lows of the two shoulders. A breakout above the neckline signals that the security's price is likely to continue moving higher.

RSI Indicator

The Relative Strength Index (RSI) oscillator has been holding up above the 50 mid-level the entire time we have developed the left shoulder, building up the bullish momentum.

If the bulls hold above the neckline, the RSI oscillator can help us confirm the move if the momentum reading holds above the 50 mid-level.

Looking forward: Above the neckline, the first level of interest is the mid-January swing low of $0.000017, followed by the resistance zone near $0.000030.

Would you like to know more about Meme coins like Shiba Inu? Read the blog The Potential Future of Meme Coins in 2022 here.

Posteingang Bild

Newsletter

Erhalte die wöchentliche E-Mail mit exklusiven Kryptoanalysen und lesenswerten Nachrichten. Bleibe informiert, völlig kostenlos.

Automatisiere
deinen
Handel!

Weltklasse automatisierter Krypto Handelsbot

Lass uns loslegen
Das Bild zeigt eine Illustration innerhalb des "Start Trading"-Banners. Die Illustration zeigt das Konzept des automatisierten Handels, wobei im Hintergrund verschiedene Finanzcharts und Indikatoren angezeigt werden. Im Vordergrund ist eine moderne und schlanke Oberfläche einer Handelsplattform zu sehen, die die Einfachheit und Bequemlichkeit des automatisierten Handels hervorhebt. Das Bild soll die Botschaft vermitteln, dass die Nutzer durch den Einsatz automatisierter Handelsstrategien ihre Handelseffizienz verbessern und möglicherweise ihre Investitionserträge maximieren können.

Verwandte Artikel

Bot Trading 101 | How To Apply a Scalping Strategy
#Automated trading strategy#Strategy designer#EMA+3 weitere Tags

Bot Trading 101 | How To Apply a Scalping Strategy

Cryptocurrencies | BTC vs. USDT As Quote Currency
#Bitcoin#crypto trading#crypto trading tips+2 weitere Tags

Cryptocurrencies | BTC vs. USDT As Quote Currency

Technical Analysis 101 | What Are the 4 Types of Indicators?

Technical Analysis 101 | What Are the 4 Types of Indicators?

Bot Trading 101 | The 9 Best Trading Bot Tips of 2023
#crypto trading#trading bot#crypto trading tips+2 weitere Tags

Bot Trading 101 | The 9 Best Trading Bot Tips of 2023

Beginne kostenlos mit dem Handel auf Cryptohopper!

Kostenlose Nutzung - keine Kreditkarte erforderlich

Los geht's
Cryptohopper appCryptohopper app

Haftungsausschluss: Cryptohopper ist keine regulierte Einheit. Der Handel mit Kryptowährungs-Bots birgt erhebliche Risiken, und vergangene Ergebnisse sind kein Indikator für zukünftige Ergebnisse. Die in den Produkt-Screenshots gezeigten Gewinne dienen nur zu illustrativen Zwecken und können übertrieben sein. Engagiere dich nur im Bot-Handel, wenn du über ausreichendes Wissen verfügst oder Beratung von einem qualifizierten Finanzberater einholst. Cryptohopper übernimmt unter keinen Umständen Haftung für (a) jeglichen Verlust oder Schaden, ganz oder teilweise, der durch Transaktionen mit unserer Software verursacht wird, oder in Zusammenhang damit entsteht, oder (b) jegliche direkte, indirekte, besondere, Folge- oder zufällige Schäden. Bitte beachte, dass der Inhalt, der auf der Cryptohopper Social-Trading-Plattform verfügbar ist, von Mitgliedern der Cryptohopper-Community generiert wird und keine Ratschläge oder Empfehlungen von Cryptohopper oder in seinem Namen darstellt. Gewinne, die auf dem Marketplace gezeigt werden, sind keine Indikatoren für zukünftige Ergebnisse. Durch die Nutzung der Dienste von Cryptohopper erkennst du die inhärenten Risiken des Kryptowährungshandels an und stimmst zu, Cryptohopper von jeglichen Haftungsansprüchen oder Verlusten freizustellen. Es ist wichtig, unsere Nutzungsbedingungen und unsere Risikohinweise zu überprüfen und zu verstehen, bevor du unsere Software verwendest oder an Handelsaktivitäten teilnimmst. Bitte konsultiere rechtliche und finanzielle Fachleute für personalisierte Ratschläge, die auf deine spezifischen Umstände zugeschnitten sind.

©2017 - 2024 Copyright by Cryptohopper™ - Alle Rechte vorbehalten.