
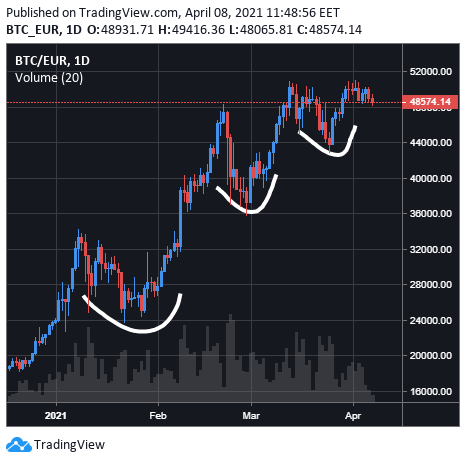
Price action is fractal. There are trends, counter-trends and consolidation patterns within every chart. This simply means that within every trend, different strategies apply. The market moves in one of three directions: up, down, or in range. The simplest strategy regarding uptrend might be buying the dips. This was probably one of the best possibilities for the current bull run in the crypto markets.
Buying the dip strategy
The logic behind buying the dips is simple, as long as we are in an uptrend. Buying the dips refers to going long on an asset after its price has experienced a short-term decline. This strategy can be profitable during long-term uptrends, as long as the trend has not broken out to the downside. A trend can be spotted with simple indicators such as RSI, MACD or similar momentum oscillators and can also be tracked by observing price movement. An uptrend can be defined as a series of higher-highs in price, followed by higher-lows. Ideally, trends should be observed over longer time frames; daily, weekly, monthly. If you are day trading, search for trends within shorter frames.
Indicating a trend using moving average (MA)
A moving average is an overlay indicator that plots the average price onto a chart over a given number of periods. It smoothens out the chart and can hint at a trend. Moving averages do not predict future prices as they are lagging indicators. They simply tell us where the price has been and the direction it’s moving in.
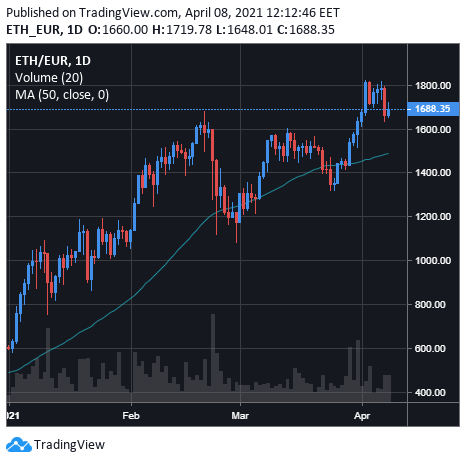
Traders use different periods of MA that suit their style. One trader might prefer a 50-day period moving average on a daily chart, while another might use a 21-day period MA on an hourly chart. Often, there are standards on trading platforms which might be worth considering. Most charting platforms use 14 days as the default setting, but this can be increased in order to decrease the sensitivity, or reduced to raise the sensitivity. The indicator can also be applied to multiple time frames, so while 14 days may be the best setting for a daily chart, a different setting might prove to be more appropriate for an hourly chart. Ideally, traders should experiment with different settings using different time frames to see what suits their style best.
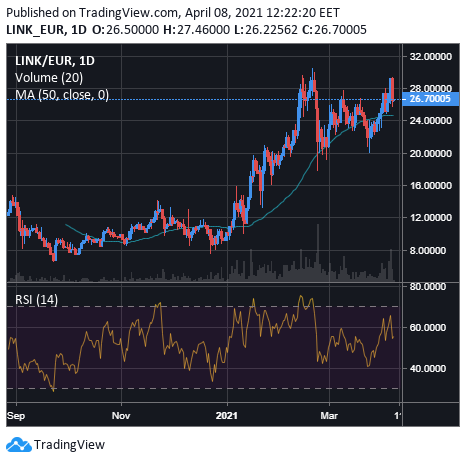
Spotting entry or exit points using RSI
Relative Strength Index (RSI) is a popular TA indicator traders can use to indicate how an asset performs over a certain period. It is a momentum oscillator that measures the magnitude of price movements and can be very helpful when setting entry and exit points. The RSI moves between 0 and 100. Signals are offered via divergences, centre line crossovers and classic charting principles.
The indicator is calculated by taking the average gain and average loss over a given number of periods, placing them into a formula and simplifying it. The indicator will reflect data from months prior to the period studied. Ideally, because of lags, it is often used with other indicators to spot the perfect time to enter or exit a position. Above 70, an asset is considered overbought, while a number below 30 indicates an oversold asset. However, an overbought or an oversold indication can be expected in cryptocurrencies markets where emotions are strong and can drive prices lower or higher for a longer time. With this in mind, RSI alone might not be sufficient to make trading decisions. Instead, the overall trend should be taken into consideration.
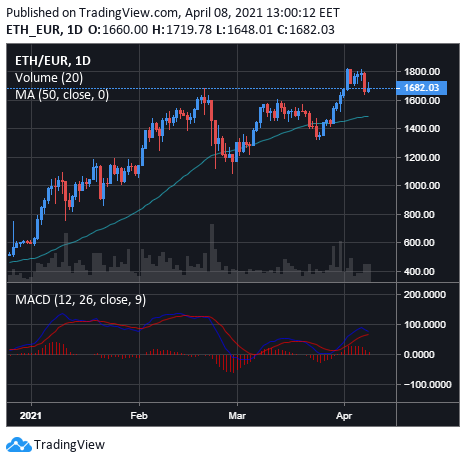
MACD indicator used as trend follower indicator
Moving average convergence divergence (MACD) is a trend-following momentum indicator that shows the relationship between two moving averages of an asset price. On most platforms, the standard MACD is calculated by subtracting the 26-period exponential moving average (EMA) from the 12-period EMA.
The indicator triggers technical signals when it crosses above (to buy) or below (to sell) its signal line. Another thing to watch out for is the speed of crossovers as a signal of a market is overbought or oversold. The crypto markets tend to move very quickly which needs to be taken into account. MACD can be used as standalone, or better, as a second choice. In basic terms, it can help to determine if the bullish or bearish movement in the price is strengthening or weakening.
Final remarks
It is your responsibility to adapt to the market movements. Generally speaking, successful traders usually put multiple concepts together to create a personalised trading strategy. There is no 100% winning rate. Pick a strategy you like, and try to stick with it. You can then test it for at least six months or even a year. Most traders change what they are doing so often, that they never truly give a single method a chance to really succeed. Always keep risk and money management in mind. According to some, the most important thing in trading is not to make money, but not to lose it.
You are not trading on Bitpanda Pro yet? Register now


