In the last episodes, we’ve covered:
SMA vs EMA for trend direction
MACD for momentum shifts
RSI for overbought/oversold zones
Bollinger Bands for volatility and price extremes
Stochastic Oscillator for timing reversals
VWAP for fair price detection
Today, we’re diving into Volume and OBV (On-Balance Volume). When read together, these two indicators reveal where institutional money is flowing before the crowd catches on.
What is On-Balance Volume (OBV)?
OBV is a cumulative indicator created by Joe Granville in the 1960s. It’s built on one simple premise: volume precedes price. Smart money moves first, price follows later.
The calculation is straightforward:
If today’s close > yesterday’s close: Buyers won. Add today’s volume to OBV
If today’s close < yesterday’s close: Sellers won. Subtract today’s volume from OBV
If today’s close = yesterday’s close: It’s a draw. OBV stays the same
The result?A running tally of buying pressure vs selling pressure over time.
Note that OBV only reacts to closing prices. Intraday swings don’t matter. You might see a deep red candle, but if the price closes higher than the day before, OBV still rises. That means buyers had the final say.
How to Read Volume + OBV:
Volume tells you how strong today’s move is.
OBV shows you whether buying or selling pressure has been stacking up over time.
Put them together, and you get both the short-term action and the bigger picture.
1. Confirmed Uptrend: Rising OBV + High Volume + Rising Price
Everything lines up: institutional accumulation (OBV), strong participation (Volume), and upward movement (Price). These are typically the most reliable trends. Momentum and smart money are both backing the move.
2. Accumulation Zone: Rising OBV + Low Volume + Sideways Price
Smart money accumulation phase. Institutions are quietly building positions without moving the price dramatically. This often precedes major breakouts when retail traders finally notice. Watch for a sudden volume spike or price breakout to confirm the move.
3. Distribution phase: Falling OBV + High Volume + Falling Price
Distribution in progress. Smart money has been selling (OBV) and now there’s panic selling (Volume). These moves often have further to go as the selling pressure has been building. If you’re holding a long position, reassess quickly.
4. Divergence Patterns The most powerful signals occur when OBV and price disagree:
Bullish Divergence: Price looks weak or stuck, but OBV quietly trends upward. That’s a sign big players are buying in. This could be a possible setup for a breakout.
Bearish Divergence: Price keeps climbing, but OBV is slipping. That means demand is thinning out underneath. Smart money may be exiting early.
5. Breakout Confirmation: Rising OBV + Spiking Volume + Price breaking resistance
This is the dream setup: institutions were already accumulating, retail jumps in, and the breakout comes with real conviction. This is often the green light. Make sure you’re not chasing too late.
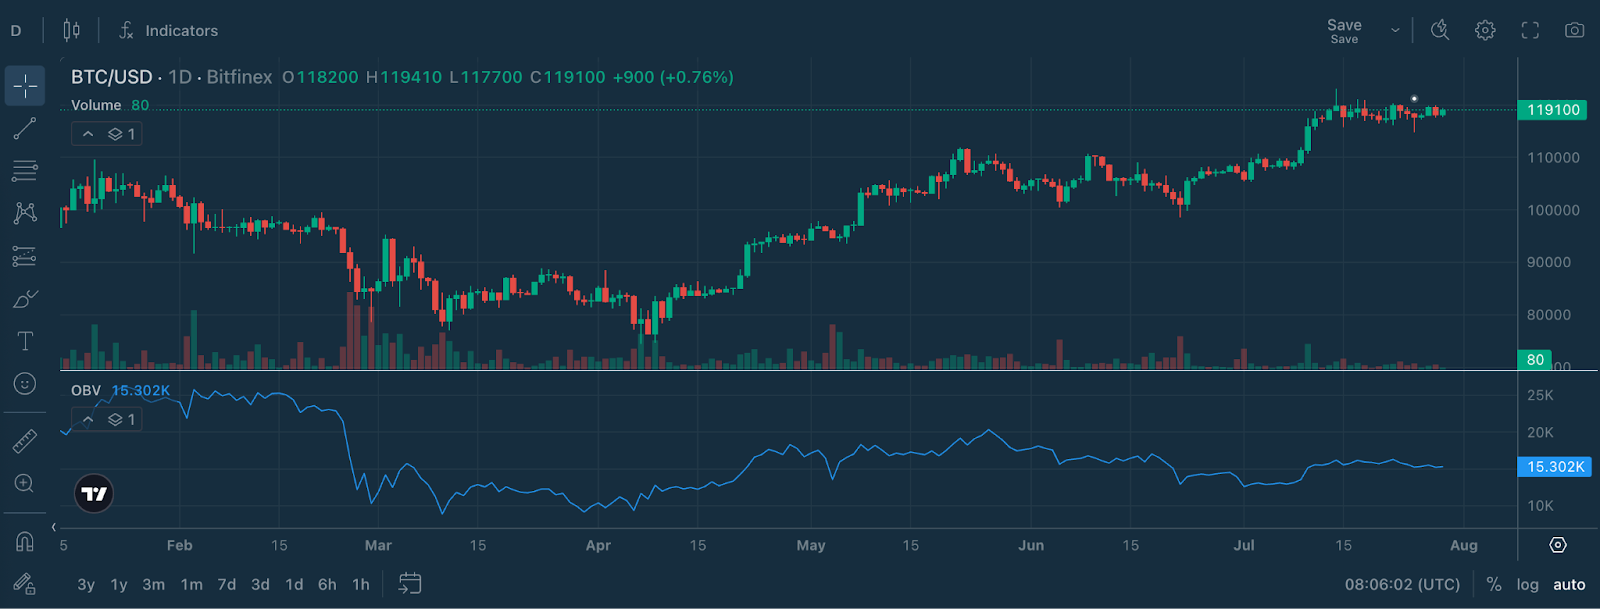
Real Example: BTC/USDT Analysis

Price: $119,100
OBV: Flat at 15,302K
Volume: Low and steady
BTC has been consolidating just under $120K after a strong rally, but OBV is no longer climbing. The line has flattened out, suggesting that while aggressive selling isn’t present, neither is continued strong accumulation. This pause in OBV could mean smart money is waiting, not selling, but not actively buying either. Volume remains light, so any breakout from here will need fresh conviction to stick.
No clear divergence for now, but the market is at a standstill. Watch OBV closely: if it starts rising again on green days, that could be the early signal bulls are back.
Volume + OBV + Other Indicators:
This combo works even better when combined with tools you already know:
Volume + OBV + VWAP: When OBV is rising and the price approaches VWAP from below with high volume, it often signals institutional support at fair value levels. A bounce could be coming.
Volume + OBV + RSI: Rising OBV with RSI in oversold territory often marks significant bottoms. Smart money is buying whilst sentiment is poor. This could be a turning point.
Volume + OBV + MACD : If OBV is rising and MACD crosses bullish, it strengthens the case for an uptrend. If OBV is falling and MACD crosses bearish, the sell signal gains weight.
Volume + OBV + Bollinger Bands: Bollinger Bands show price extremes. OBV can tell you if those extremes are supported by real pressure.
If the price hits the lower band, but OBV is rising, this could be quiet accumulation during a pullback. A possible rebound may be brewing.
If the price hits the upper band, but OBV is failing, this could signal distribution during the hype. A possible correction could follow.
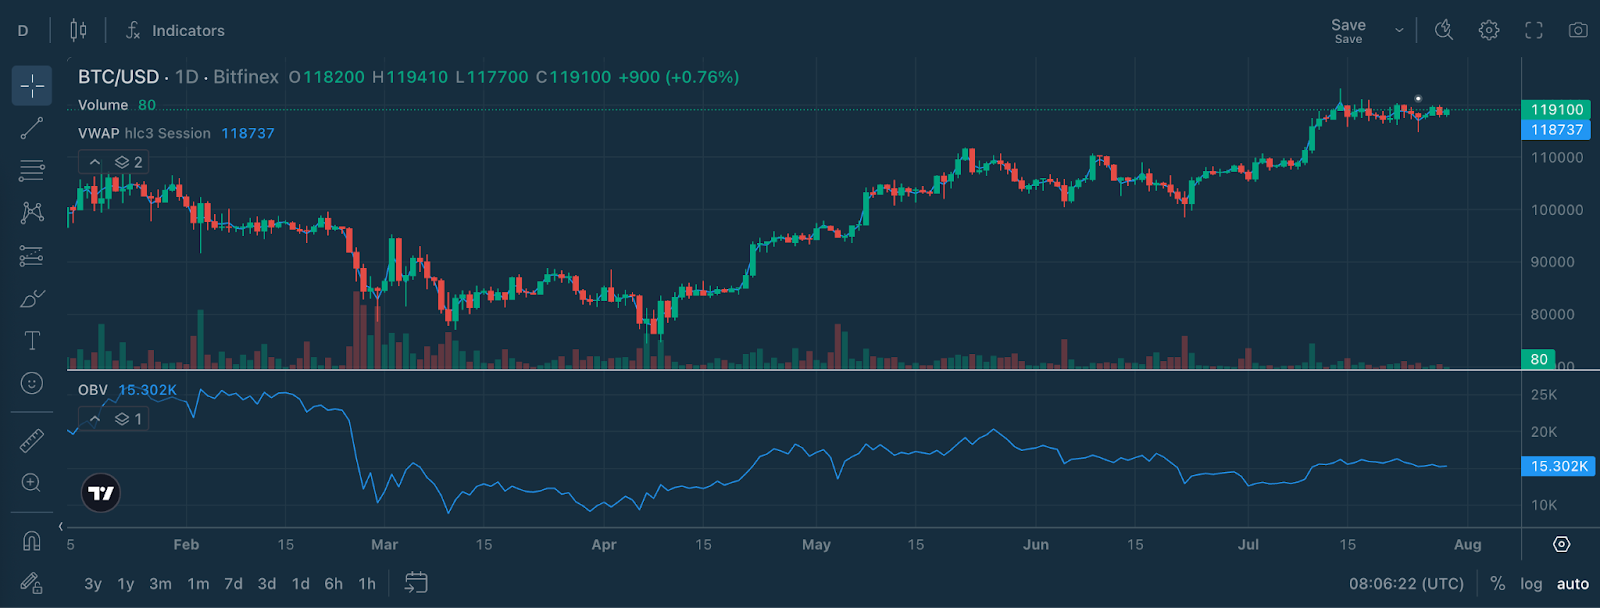
Bonus Read: OBV + Volume + VWAP – The Triple Confirmation Setup

Price: $119,100
VWAP: 118,737
OBV: Flat at 15,302K
Volume: Low and steady
Here’s what this chart is telling us:
Price is slightly above VWAP, which suggests BTC is trading just above its fair value based on recent volume. That’s neutral to mildly bullish but not a strong signal on its own.
OBV has flattened out after a solid uptrend, showing that cumulative buying pressure has stalled. Smart money might be taking a breather, they’re not selling, but not actively buying either.
Volume remains light, so while there’s no panic selling, there’s also no surge of conviction from either side.
Conclusion: This is a neutral zone. Price is holding steady just above VWAP, but OBV and volume aren’t confirming a breakout yet. If OBV starts rising again with a volume spike, that could be your green light. Until then, stay patient.
Pro Tips for Volume + OBV:
1. Use Multiple Timeframes
Daily OBV: Shows longer-term institutional flow
4-hour OBV: Good for swing trading setups
1-hour OBV: Helps with precise entry timing
2. Watch Trend Changes, Not Just the OBV Value
Don’t just look at whether OBV is positive or negative. Watch for changes in the trend. A rising OBV after a long decline can be more meaningful than one that’s been flat for weeks.
3. Volume Quality Matters
Not all volume is equal. Activity during London/New York sessions often reflects institutional participation, whereas weekend or early-Asia volume may be noise.
4. Combine with Key Price Levels
OBV works best when price is also near support or resistance. If OBV is rising and price is pushing toward resistance, a breakout might be coming. If OBV is falling and price is near support, it could break lower.
5. Be Patient with Divergences
Divergences between price and OBV can persist for days or weeks. Just because OBV is rising while price is flat (or falling), doesn’t mean a breakout will happen today or tomorrow. Big players often build their positions slowly and quietly. It can take time before the price catches up.
6. Know the Limitations
Choppy markets: OBV gives mixed signals during extended sideways action as money flows back and forth without clear direction.
News events: Major developments can distort OBV readings due to price gaps.
Never use alone: Always combine with other indicators and price action for confirmation.
Try It on Bitfinex:
Log in to Bitfinex
Choose any major trading pair (BTC/USD, ETH/USD work well)
Add the Volume histogram at the bottom
Add OBV from the indicators menu
Look for the patterns we’ve discussed
Practice spotting divergences between price and OBV
See Volume + OBV in action
Next in the Chart Decoder Series: ATR (Average True Range): How to measure market volatility and position size like a pro.
Bitfinex. The Original Bitcoin Exchange.
The post appeared first on Bitfinex blog.

