Welcome back to the Chart Decoder Series, where we translate our pro trading tools into strategies you can use today.
So far, we’ve tackled:
- SMA vs EMA for trend direction
- MACD for momentum shifts
- RSI for overbought/oversold zones
- Bollinger Bands for volatility and price extremes
- Stochastic Oscillator for timing reversals
- VWAP for fair price detection
- Volume + OBV for spotting smart money flow
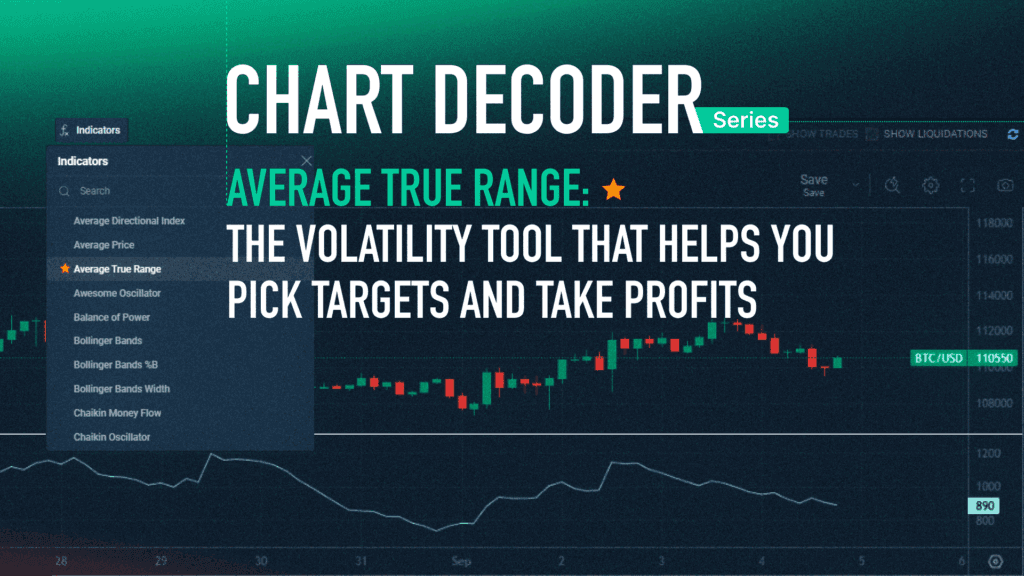
Today, we’re exploring ATR (Average True Range), the indicator that solves one of trading’s biggest puzzles: how much should you risk, and where should you place your stops?
What ATR Really Tells You
ATR was developed by J. Welles Wilder Jr. in 1978 as part of his groundbreaking work on technical analysis. Unlike most indicators that focus on price direction, ATR measures one thing only: volatility.
ATR answers a crucial question: “How much does this market typically move?”
The calculation: ATR looks at the “True Range” for each period, which is the largest of:
- Current High – Current Low
- |Current High – Previous Close|
- |Current Low – Previous Close|
Then it takes a moving average of these True Range values over your chosen period (14 is the standard on Bitfinex, but you can adjust it to any period you like)
The absolute values ensure ATR always shows positive numbers, regardless of whether gaps occur up or down.
Why ATR Matters:
ATR goes beyond context. It shapes how traders manage risk, size positions, and set exits. Rather than relying on just a gut feeling, it provides objective measurement of market behaviour that directly informs every trading decision.
1. Smarter Stop Losses
Placing stops without ATR is basically guesswork. ATR shows you what counts as “normal” movement, so you’re not thrown out by everyday swings.
- Scalping stops (0.5× ATR): Used by high-frequency traders who want quick exits at the first sign of trouble. Only effective during low-volatility periods when market movement is predictable
- Standard stops (1× ATR): Provides enough room for normal price fluctuations whilst maintaining reasonable risk control
- Position stops (2× ATR): For traders holding multi-day positions who need to survive normal daily volatility cycles without premature exit
2. Size Your Position Appropriately
Professional risk management is about maintaining consistent risk exposure regardless of market conditions. Instead of trading the same size in every condition, you adapt smaller positions when volatility is high, larger ones when it’s calm.
3. Spotting Volatility Breakouts
A breakout accompanied by expanding ATR shows institutional participation and genuine directional conviction. When price breaks key levels but ATR remains flat, it often indicates weak follow-through and higher probability of reversal. The most powerful setups occur when price breaks significant levels with ATR expansion, confirming both direction and momentum.
4. Set Profit Targets
ATR multiples provide a rational framework for setting realistic profit targets, helping you step away from guesswork and toward consistency.
- Conservative: 1.5 × ATR
- Standard: 2 × ATR
- Aggressive: 3 × ATR
Real Example: BTC/USD Analysis
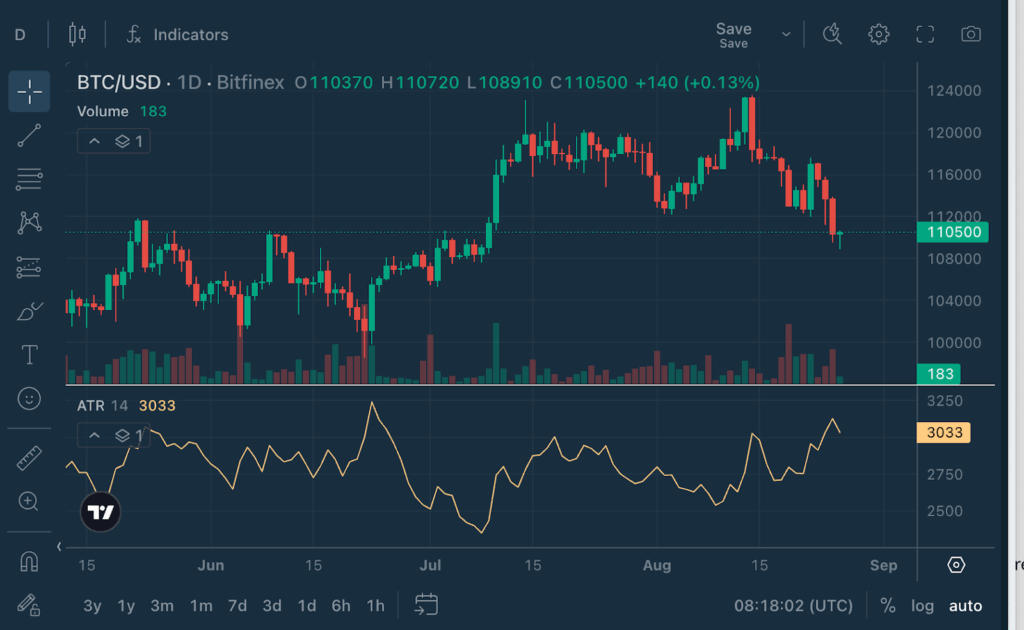
Price: $110,500ATR (14): 3,033
What this tells us:
Bitcoin’s recent average daily movement is about $3,033. This gives traders clear context:
- A $3,000 move isn’t exceptional, it’s right in line with 1× ATR
- Stop loss around $3,000 (1× ATR) provide normal breathing room
- Profit targets of $4,500–$6,000 (1.5–2× ATR) are realistic for swing trades
- ATR at this level signals a moderately volatile market that demands careful position sizing and risk management
ATR + Other Indicators:
ATR becomes even more powerful when combined with other tools:
ATR + Bollinger Bands: When price hits Bollinger Band extremes with high ATR, the move has more conviction. Low ATR at the bands might suggest the extreme won’t hold.
ATR + RSI: RSI oversold conditions with rising ATR often mark significant bottoms. The high volatility shows real selling pressure, making the oversold reading more meaningful.
ATR + MACD: MACD crossovers with expanding ATR are more reliable than those with contracting ATR. Volatility confirms the momentum shift has conviction.
ATR + Volume + OBV: The triple combination: OBV shows smart money direction, Volume shows immediate conviction, ATR shows how much movement to expect. When all align, you have high-probability setups.
Bonus Read: ATR + RSI in Action
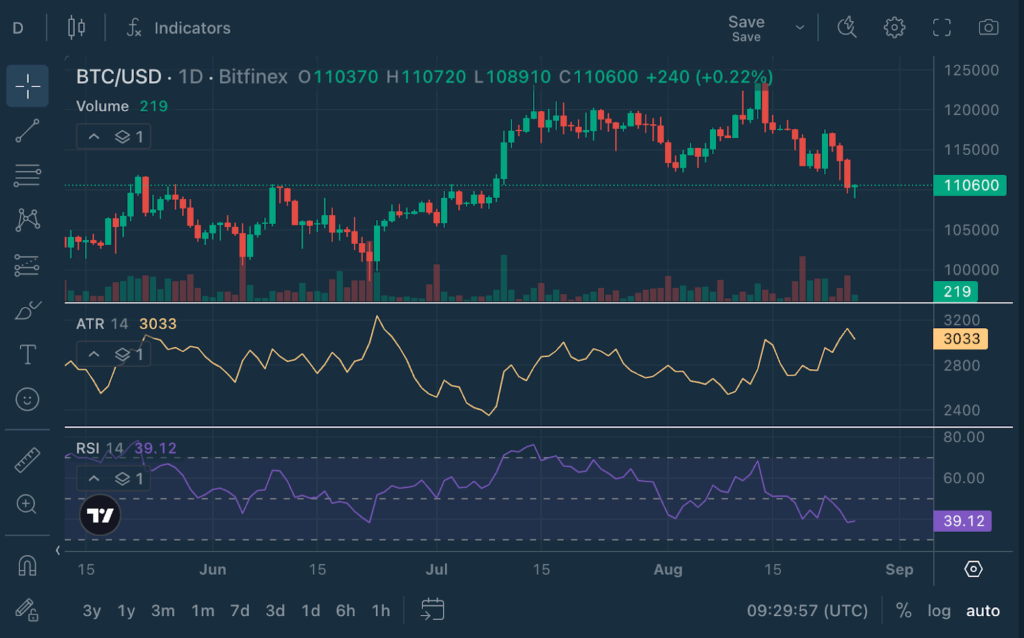
Price: $110,600ATR (14): 3,033RSI (14): 39.12 (near oversold)
What this tells us:
- RSI at 39 is below neutral (50) but above the oversold threshold of 30, showing bearish momentum without yet being extreme.
- ATR at 3,033 shows daily volatility is elevated, meaning swings are large.
For traders:
- Bearish RSI + high ATR = selling pressure is active and backed by volatility.
- If RSI approaches 30 while ATR remains high, the market is not just drifting lower but being sold with force. Oversold conditions would carry more weight.
- If RSI starts climbing back up whilst ATR remains high, any bounce is likely to have some real strength behind it, not just a weak recovery.
ATR Limitations to Remember:
Lagging IndicatorATR is based on past price movement. It tells you what volatility was, not necessarily what it will be.
No Directional BiasATR doesn’t tell you which way the market will move, only how much movement is typical.
Smoothed DataLike all moving averages, ATR can be slow to react to sudden volatility changes.
Market Context MattersATR during trending markets behaves differently than during sideways markets. Always consider the bigger picture.
Pro Tips for ATR:
1. Use Multiple Timeframes
- Daily ATR: For swing trading and position sizing
- 4-hour ATR: For day trading setups
- 1-hour ATR: For precise entry timing
2. Economic Calendar Integration
ATR often spikes around major news events. Plan your position sizing and stop placement accordingly.
3. Weekend Effect
Crypto markets trade 24/7, but volatility patterns often change on weekends. Consider separate ATR calculations for weekdays vs. weekends.
Try It on Bitfinex:
- Log in to Bitfinex
- Choose any major trading pair
- Add ATR indicator (Start with the standard 14 periods. Length can be adjusted within the ATR settings)
- Observe how ATR changes during different market conditions
- Practice using ATR for stop loss placement
- Notice correlation between ATR and major price moves
Bitfinex. The Original Bitcoin Exchange.
The post appeared first on Bitfinex blog.