_webp.webp&w=3840&q=75)
How to Find Support and Resistance Levels: Tips for Traders
Support and resistance levels are critical tools in trading, helping investors predict market movements and make strategic decisions about asset prices.
TLDR: Support and resistance levels are essential tools in technical trading, helping you spot reversals, plan entries and exits, and manage risk. This guide covers how to draw, choose, and refine these levels using proven techniques for smarter, more confident trades.
How to draw lines
Choosing strong levels
Common mistakes to avoid
Advanced tops on support and resistance strategies
What are Support and Resistance levels?
Support and resistance levels are foundational concepts in technical analysis. They help traders identify where an asset’s price is likely to pause, bounce, or reverse. In order to pick these levels correctly, you need to understand how they work.
Support levels are created when the demand for a stock or crypto is greater than the supply. This causes the price of the stock or cryptocurrency to increase.
On the other hand, resistance levels are created when the supply of a stock or crypto is greater than the demand. This causes the price of the item to decrease.
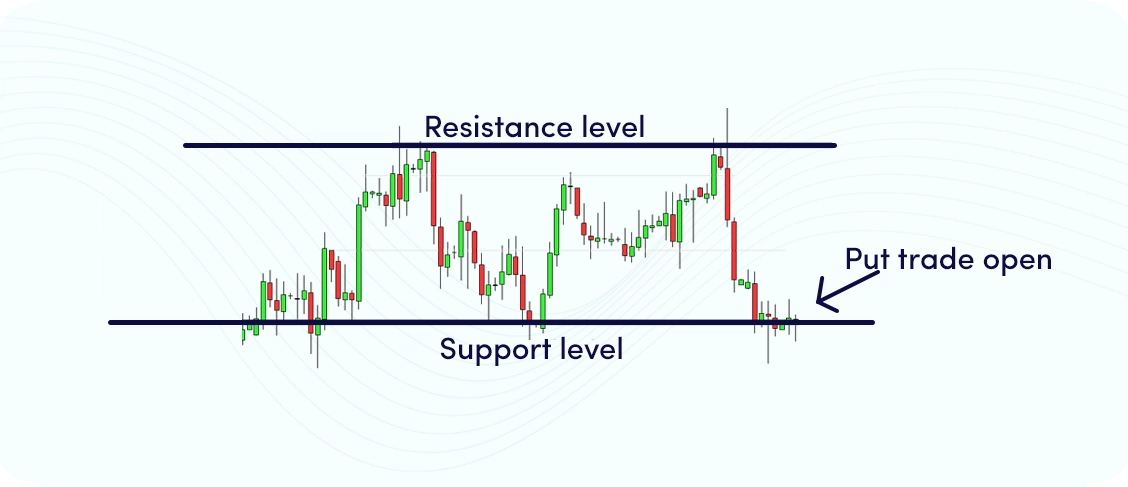
How to Draw Support and Resistance lines
Learning how to draw support and resistance lines is a foundational trading skill—and one that improves with practice. Here are a few things to keep in mind when drawing Support and Resistance lines.
First, you want to make sure that the lines are horizontal. This will help you to easily see the price action and identify potential reversals.
Second, you want to make sure that the lines are drawn at key levels. This means identifying areas where the price has reversed in the past or where there is a significant level of Support or Resistance.
Finally, you want to make sure that the lines are spaced evenly. This will help you to more easily identify potential breakouts or trend reversals.
How to Choose Support and Resistance Levels
Once you've drawn potential lines or zones, the next step is learning how to choose the most reliable support and resistance levels for your strategy. Not every level on the chart is worth trading around Some Support and Resistance levels are underrated and often ignored by retail traders, but they’re usually the most powerful levels.
The first Support and Resistance levels you should start paying more attention to are the higher time frame levels, more specifically, the yearly pivot points. These levels show us who is in control of the market.
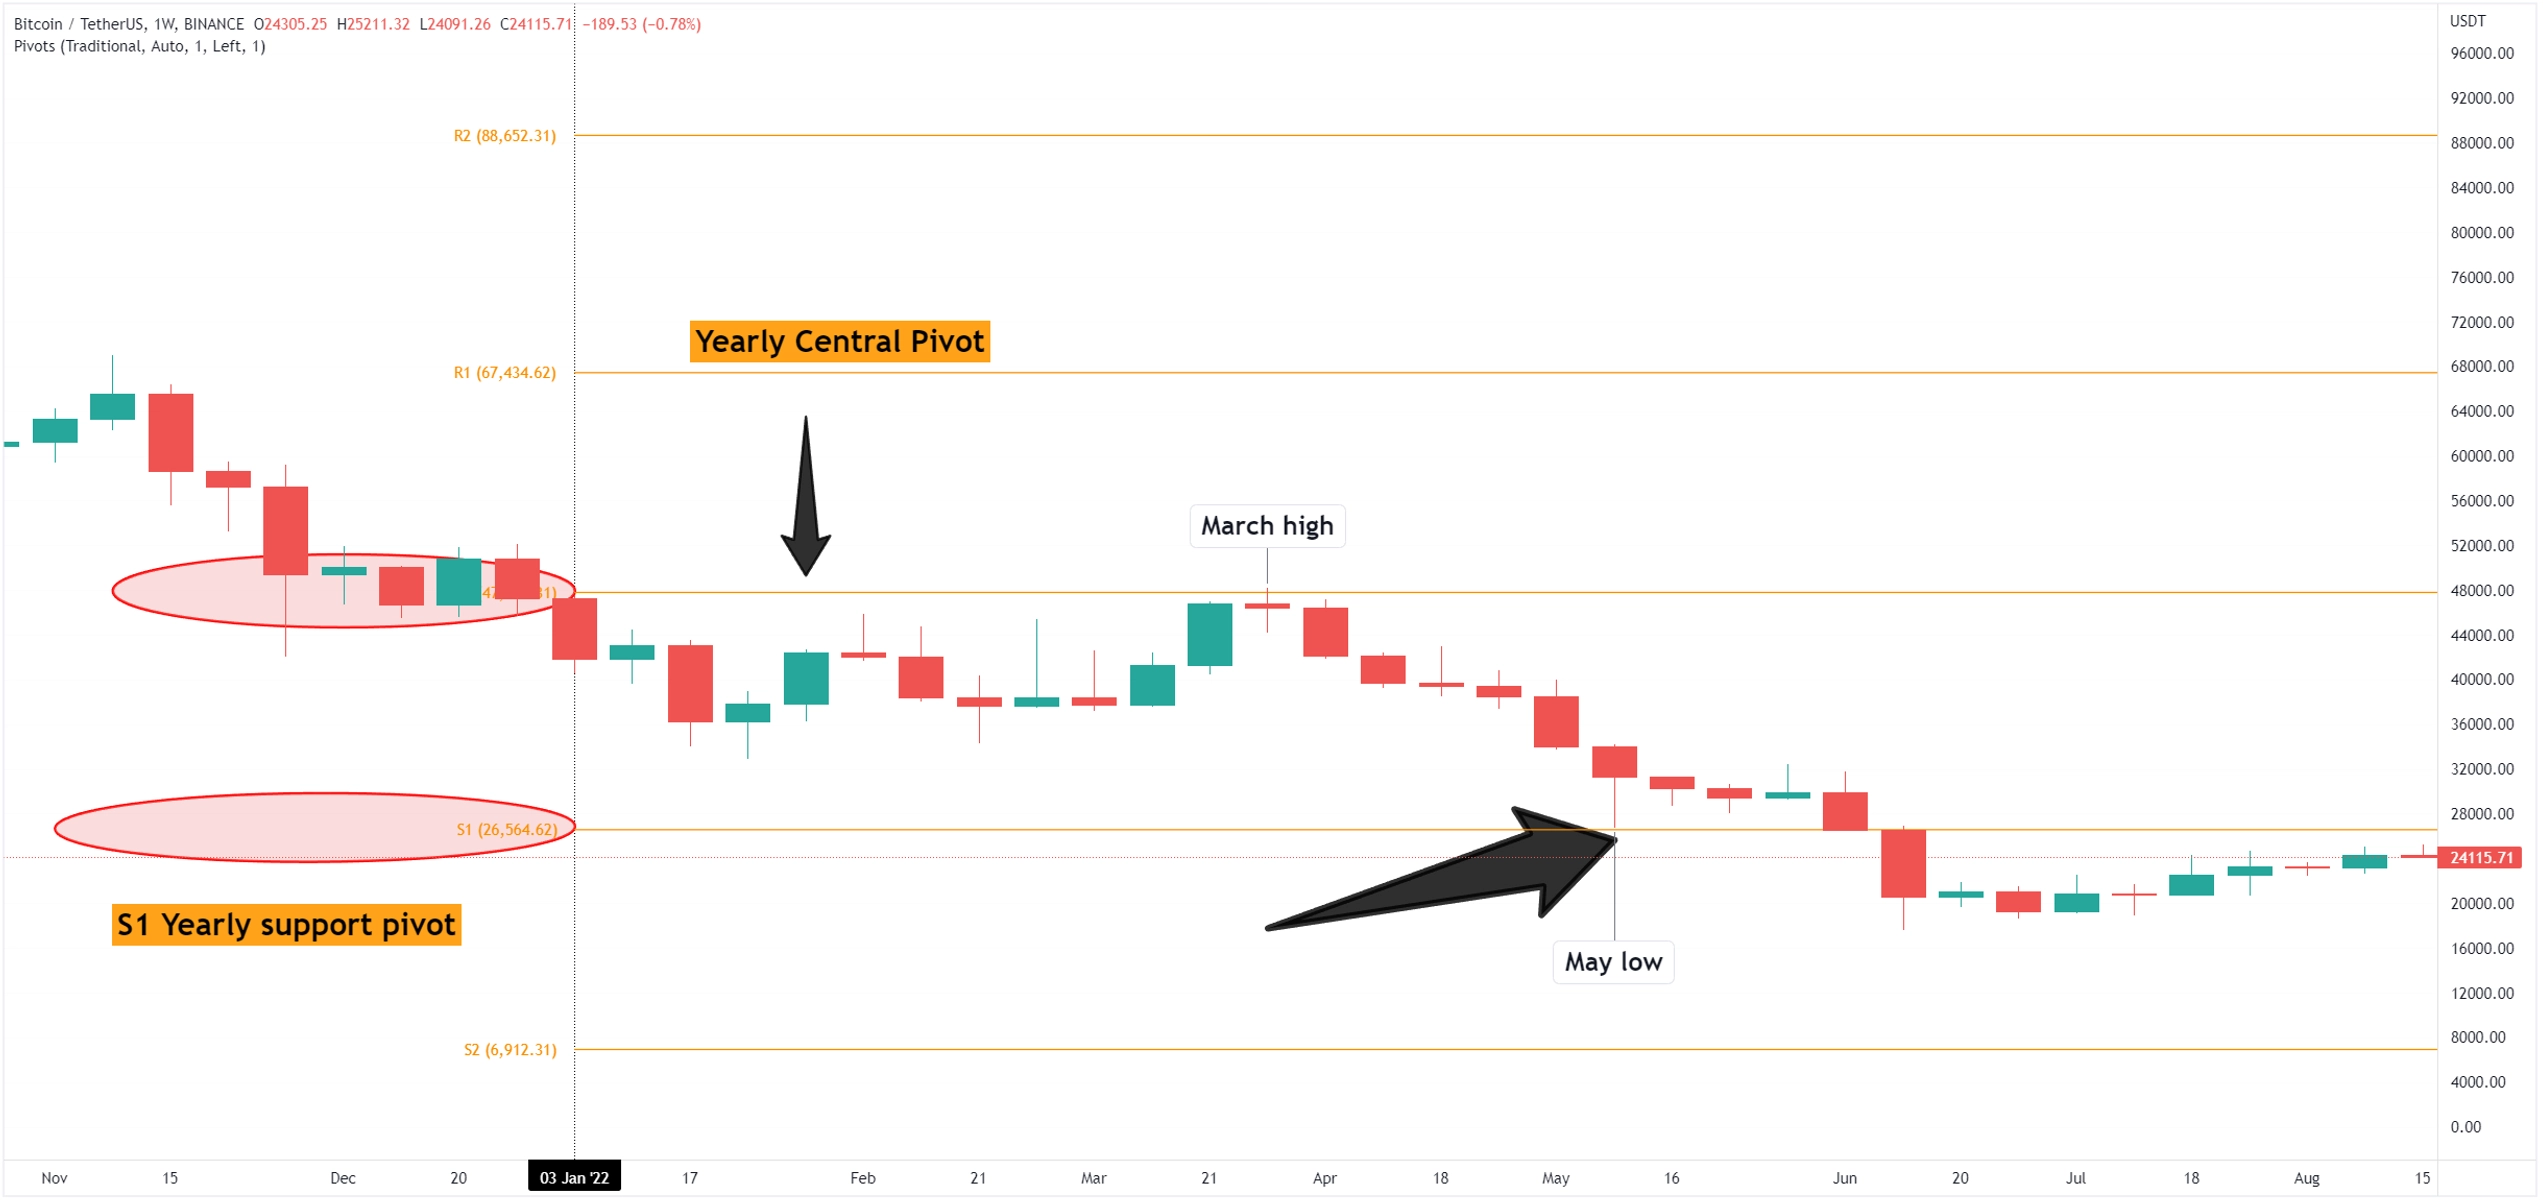
On the Bitcoin weekly chart, we can see how BTC rejected the yearly central pivot point back in March 2022 and how this area acted as a resistance at the beginning of the year.
Moreover, we can observe how the marginal low point established in May is actually the S1 early support level.
You would have missed these Support and Resistance levels if you only focused on the intraday price action. Most of these levels are not visible on intraday timeframes.
Avoid These Common Mistakes
Choosing too many levels, which clutters your chart and clouds decision-making
Relying only on recent price spikes without confirming with volume or structure
Ignoring wicks or focusing only on candle bodies when the price action suggests otherwise
Other Practical Tips to Improve Your Support and Resistance Strategy
Update your Support and Resistance levels regularly.
Markets are dynamic, and so are support and resistance lines. What worked yesterday might not hold today. Make it a habit to update your levels frequently based on recent highs, lows, and price action.
Pro Tip: Reassess your levels after major market moves or high-volume trading sessions to stay aligned with the current trend.
Use Price Zones, Not Just Lines
While it’s common to draw horizontal support and resistance lines, relying solely on single price points can be misleading. Instead, use price zones—ranges where price tends to stall or reverse.
These zones offer a more realistic view of market behavior, especially in volatile or fast-moving assets like cryptocurrencies.
Switch to Line Charts to Filter Out Noise
Candlestick charts can be noisy—especially on shorter timeframes. Occasionally switching to a line chart can help filter out intraday fluctuations and reveal clearer support and resistance levels.
This minimalist approach can help sharpen your view of true market structure and avoid false signals.
Use Confluence Clusters Factors
Stronger support and resistance zones often form when multiple indicators align—this is called confluence. Look for:
Pivot points
Previous highs/lows
Fibonacci retracement levels
Volume profile areas
Combining these factors strengthens your support and resistance strategy and gives you more confidence when placing trades.
Final Word on How to Determine Support and Resistance Levels
Picking the right Support and Resistance levels can be tricky, but it's definitely worth taking the time to learn how to do it correctly. After all, these levels are crucial for technical analysis and can make a big difference in your trading results.
We hope that our tips have helped you figure out how to pick Support and Resistance levels like a pro.


_webp.webp&w=3840&q=75)
_webp.webp&w=3840&q=75)


