Bitcoin’s Rising Bullish Channel Caps Downside at $20,000
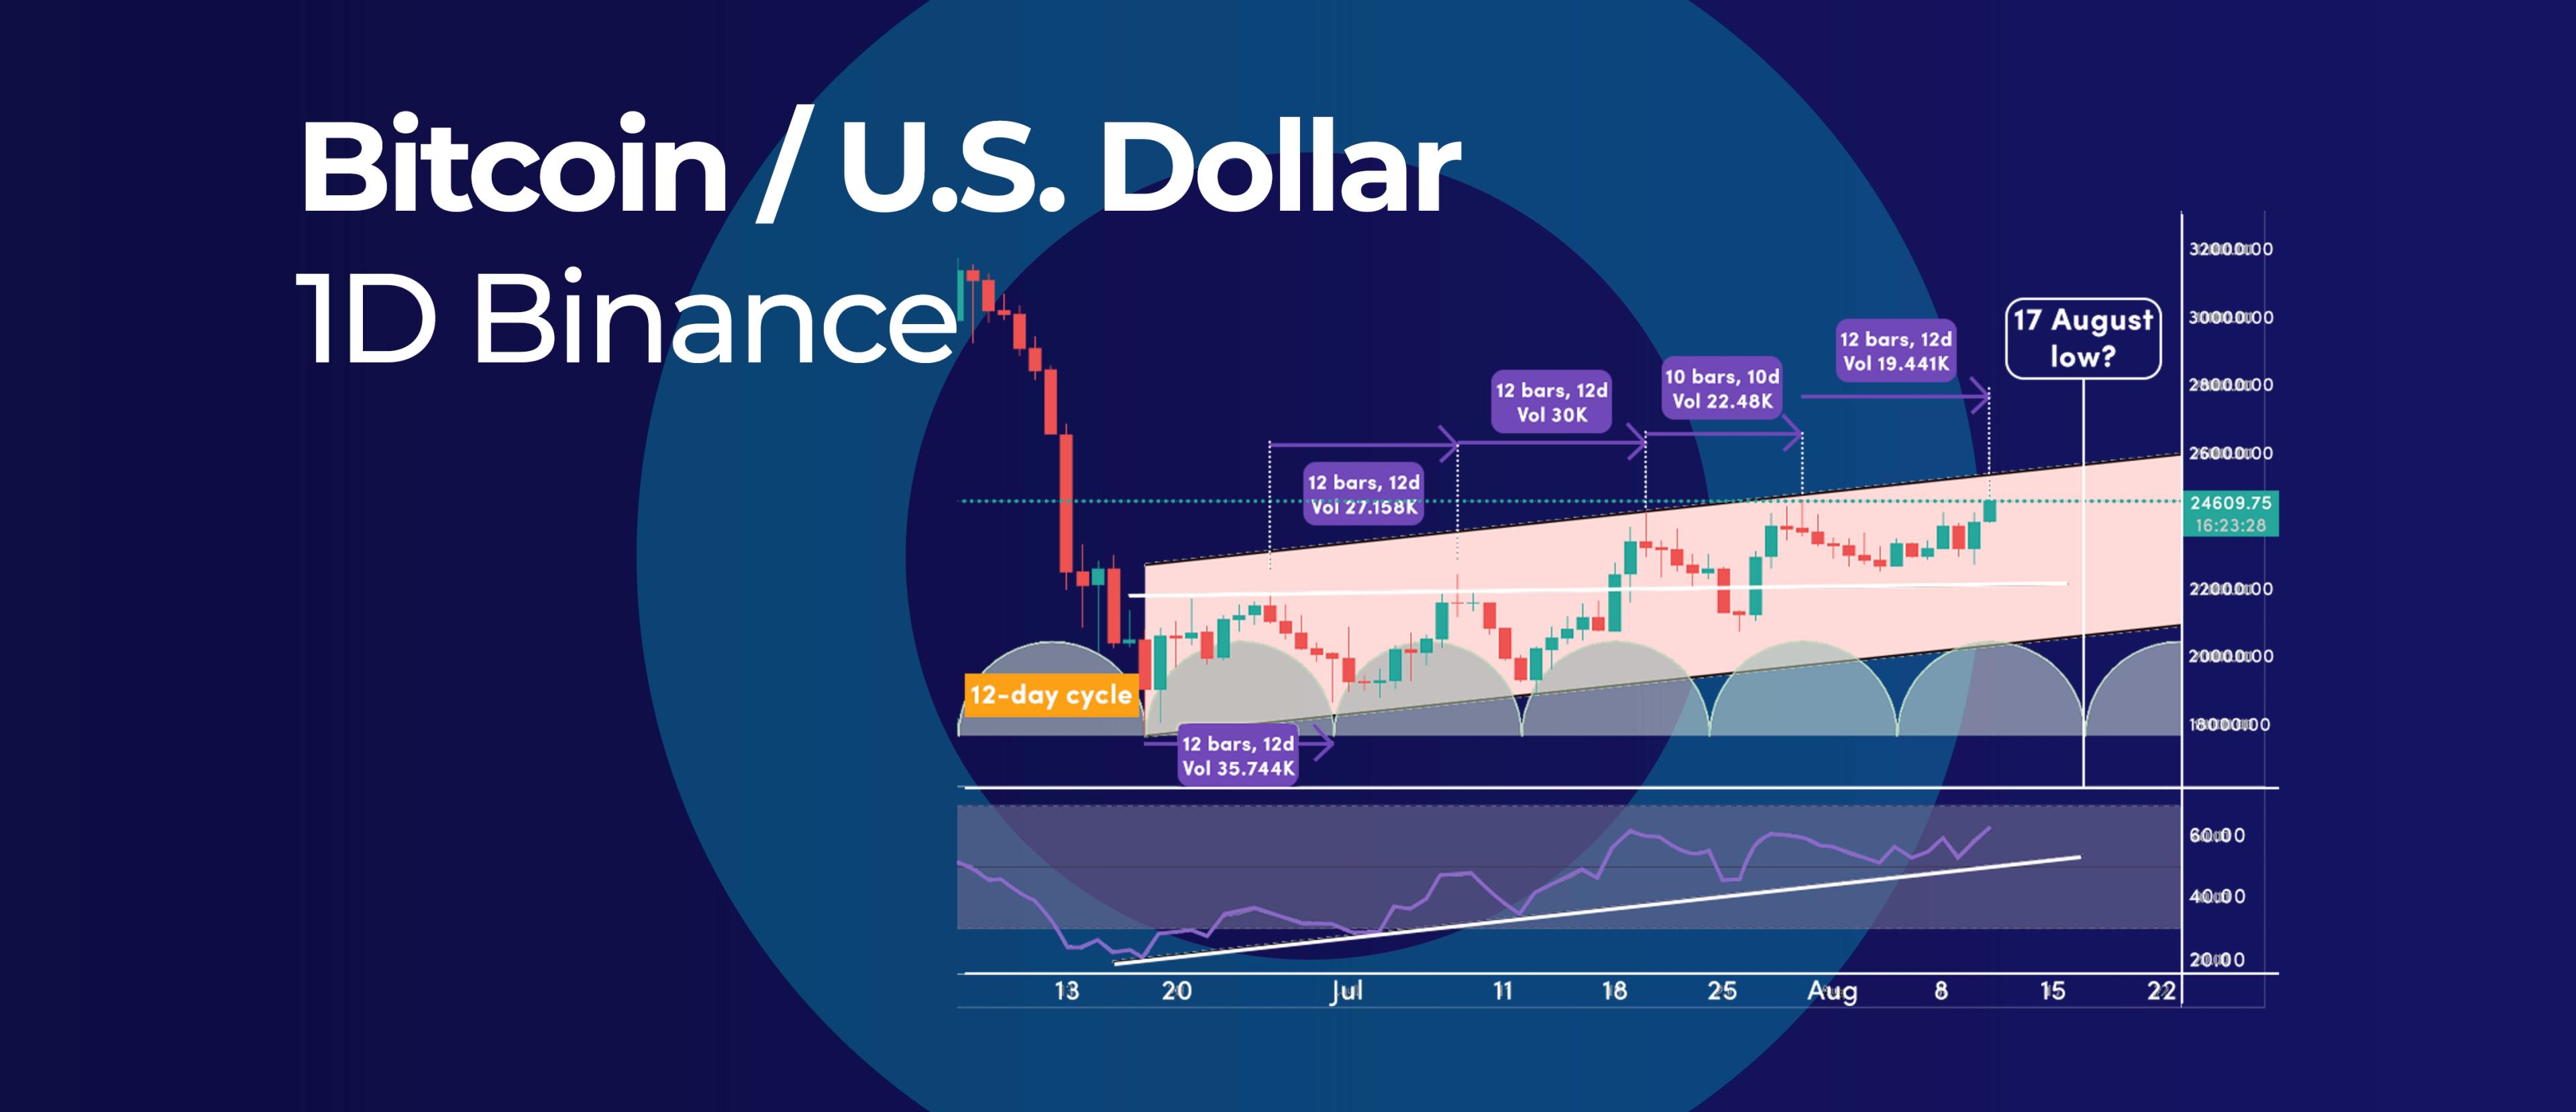
The broad technical picture depicts Bitcoin (BTC) as trading within a rising bullish channel that supports the chances of continuing to move to the upside. Additionally, since June 18 low, Bitcoin has a cyclicity in that the price action is operating an important 12-day cycle, which calls mid-August to be another intermediate bottom.
Ascending Channel
Starting with June 18 low, Bitcoin's entire price action structure can be framed within an ascending channel pattern, which is a bullish signal.
As long as the BTC price remains within the ascending channel, the upside and the downside are capped at $25,500 and $20,000, respectively.
What is a Ascending Channel?
An ascending channel is a bullish pattern that forms when price action rallies higher between two parallel trendlines. This formation indicates that buyers are in control and that they are willing to step in and support the market at higher levels.
The upper trendline of the channel acts as resistance, while the lower trendline provides support. A breakout above resistance could signal further upside, while a breakdown below support could lead to additional losses.
12-Day Cycle
While cycles are never intended to pinpoint with 100% accuracy tops and bottoms, the 12-day BTC cycle has an almost perfect symmetry as it can be found between two highs and between two lows.
The first 12-day high-to-high cycle can be measured from June 26 high through July 8 high. Moving forward with each subsequent BTC swing high point, we can note that in the near term, the cycle has started to shrink slightly. The distance between the last two BTC highs is only 10 days.
However, the 12-day low-to-low cycle is more important because it can signal when we can expect the next swing low. The target date of the 12-day cycle low is August 17.
Looking forward: The middle of the channel around the $22,000 mark can provide short-term support. But what's more important is for the daily Relative Strength Index (RSI) to hold above the 50 mid-level or, more importantly, above the RSI trendline. An RSI break below the trendline can jeopardize the bullish case scenario.