Technical Analysis 101 | Best Volatility Indicators for Crypto Trading
Dive into technical analysis with top volatility indicators for crypto trading. Master Bollinger Bands and ATR to optimize your crypto strategies.
Cryptocurrencies are known for their significant price fluctuations, which has contributed to their popularity. Even individuals with limited knowledge about the blockchain and technology behind them, such as your neighbor or a friend, have been drawn to invest in these digital assets.
As an investor, you've probably noticed that Bitcoin stands out as one of the most volatile assets in recent times.
In a media landscape filled with contrasting opinions about its value, ranging from immense worth to worthlessness, Bitcoin's volatility has become a defining characteristic.
While traditional trading often involves smaller degrees of volatility that might not be immediately evident on a price chart, these fluctuations can greatly impact your investments.
In the world of trading, volatility isn't just a random term; it's a category of indicators that serve to measure the price's fluctuation within a specific time frame.
These indicators are invaluable tools that help you, as a trader, determine when a market becomes more volatile, signaling increased trading activity and potential opportunities.
Understanding these indicators is essential for making informed decisions in the dynamic environment of trading.
"When trading cryptocurrencies, volatility isn’t something that you should let go unnoticed. Once you’ve mastered these indicators, you’ll be able to take advantage of strong price movements to obtain significantly higher percentage returns on your trades."
Traders, like you, appreciate volatility because it drives price movements, creating opportunities for profitable trades.
Volatility often comes with increased trading volume. In contrast, markets with low volatility can be less exciting and potentially less profitable, as they might also lack liquidity.
Furthermore, when prices are highly volatile, they are less likely to move within a range, which means more opportunities for trending positions—whether it's an upward or downward trend, rather than trading sideways. Understanding and harnessing volatility is a key aspect of successful trading.
The significant volatility in cryptocurrencies is likely the factor that has drawn many investors and rapidly driven prices to high levels.
However, it's crucial to be aware that volatility can also trigger stop-loss orders prematurely, causing traders to miss out on potentially profitable trades while following a trend.
This is why volatility is often seen as a double-edged sword, offering both opportunities and risks for traders like yourself.
Bollinger Bands
Bollinger Bands is one of the most renowned indicators for identifying volatility. It consists of three lines: a simple moving average and two standard deviations, one upper and one lower.
These values can be adjusted to match your trading preferences. The bands essentially gauge a market's volatility.
When there's higher volatility, the bands expand, and they contract during less volatile periods. This can be a valuable tool for traders like you to assess and respond to market conditions effectively.
Strategies utilizing Bollinger Bands can be quite versatile. Traders like you often combine them with other indicators that offer insights beyond just volatility.
In fact, John Bollinger, the creator of Bollinger Bands, recommended using them in conjunction with two or three additional types of indicators. This multi-indicator approach can provide a more comprehensive view of market dynamics and help you make informed trading decisions.
The number of indicators you would like to use with the Bollinger bands is up to you, a lot of traders prefer to combine them with 2 other indicators.
Here's a practical way to use Bollinger Bands: they can help you identify overbought or oversold zones when the price breaks through the upper or lower band.
You can enhance this strategy by pairing it with momentum indicators like RSI, Stochastics, or even by closely examining price movements and candlestick patterns.
When employing this strategy, you'll want to buy when the price breaks below the lower Bollinger Band and the RSI has entered oversold territory.
Conversely, you should consider selling when the price breaks above the upper Bollinger Band and the RSI reaches overbought levels.
It's essential to keep in mind that while this approach can be effective in a ranging market, it may not perform well in a bear market. In bear markets, prices can stay oversold for extended periods before rebounding.
As a result, you might find yourself in a long position as the market continues to decline. To mitigate this, consider using a stop loss or restricting your trades to range-bound or uptrending markets. This way, you can adapt your strategy to different market conditions.
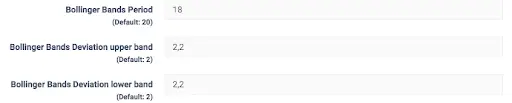
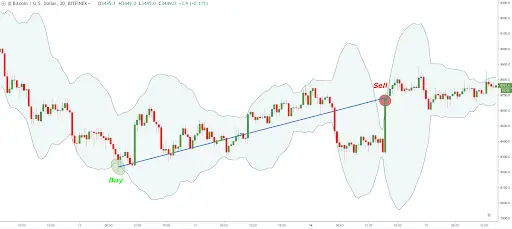
Figure 2 provides an example of how Bollinger Bands operate on Cryptohopper. When the price breaks below the lower band, it triggers a buy signal, and conversely, when the price breaks above the upper band, it generates a sell signal.
This is how the Bollinger Bands indicator is applied in real-time trading on the platform.
ATR
The Average True Range (ATR) is a volatility indicator depicted as a line at the bottom of the chart. When it starts to rise, it indicates increased market volatility, while low volatility keeps it closer to the 0 level.
This can be a valuable tool for assessing market conditions and making informed trading decisions.
The Average True Range (ATR) is calculated by comparing the current price range with its past range, typically consisting of a high and a low over a specific period of time. When the price moves beyond its recent range, the ATR value increases, indicating higher volatility.
Conversely, when the price remains within the range, the ATR hovers close to the 0 level. In simple terms, larger price range movements result in higher ATR values. This indicator can help you gauge the extent of market fluctuations.
The Average True Range (ATR) serves as a valuable tool for identifying potential trend beginnings, especially when the price breaks through a range's support or resistance, as shown in Figure 3.
When the range's resistance is breached, it raises questions about whether this is a false breakout or the start of an upward trend. This is where the ATR comes into play, helping you assess the likelihood of a sustained trend.
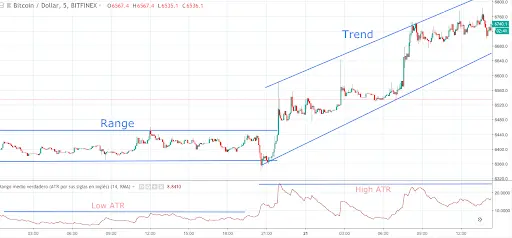
When the price breaks a range, the ATR levels usually start rising. If you see multiple spikes in the ATR after the breakout, it indicates increased volatility and higher trading activity in the market. This could mark the beginning of a new trend, and you may consider opening a long position at this point.
On Cryptohopper, we've incorporated the Exponential Moving Average (EMA) into the ATR indicator. This modified ATR sends a buy signal when it's above the EMA and a sell signal when it's below the EMA.
You can use this as a filter in your trading strategy. For instance, you can employ a trend-following indicator like MESA for buy or sell signals and use the ATR as a filter. This way, you'll only act on signals during volatile market conditions, which is when trend-following indicators tend to perform best.
Bottom Line Cryptocurrencies gained widespread attention due to their remarkable volatility, notably during the 2017 bull market when prices skyrocketed. Volatility indicators are handy for identifying the beginning of a new trend after a period of price stability.
However, it's important to use this indicator cautiously. While it can enhance profits, it can also trigger stop-losses and signal reversals in the opposite direction of your trade, potentially leading to losses.


_webp.webp&w=3840&q=75)
_webp.webp&w=3840&q=75)


