0%
A Unique Way to Use the RSI in Crypto Trading
#Stop-loss#Cryptocurrency#crypto trading tips+2 weitere Tags

A Unique Way to Use the RSI in Crypto Trading

The Relative Strength Index (RSI) is not just a popular momentum oscillator, but it’s also a very versatile indicator. Once you understand the power of the RSI indicator and how to use it correctly, you will know when it’s the best time to enter and exit a trade.

RSI Trendline Setup

There are many different ways to use the RSI oscillator, but a unique way to use it in cryptocurrency trading is the RSI trendline setup.

This method implies using trendlines on the oscillator itself instead of the price.

The RSI trendline strategy will help you find leading signals.

How to Draw RSI Trendlines

RSI trendlines are drawn by connecting at least two peaks or valleys on the oscillator itself. An RSI trendline is drawn in an uptrend by connecting higher swing lows on the oscillator itself.

Conversely, in a downtrend, an RSI trendline is drawn by connecting lower swing highs.

A trading opportunity is presented when the RSI trendline is broken. When the RSI changes direction, that’s a leading signal that has the potential to result in a significant move in the crypto price.

RSI Trendline examples

Here is an example of an RSI trendline break in the Bitcoin/USDT market.

RSI example trendline

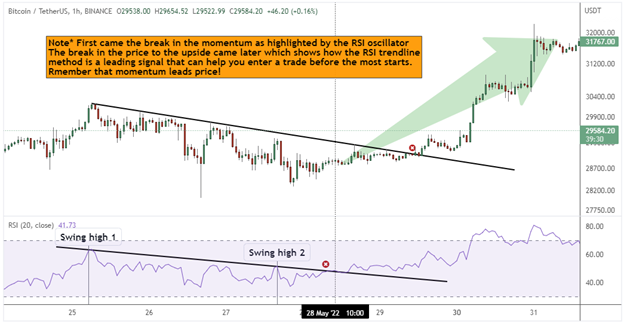
An RSI trendline break is a strong leading indicator. If you are trading a cryptocurrency in the direction of the trend, you can use the RSI trendline break as a trigger to exit your trade. Conversely, if you are trading against the trend, the RSI trendline break could be a good trigger to enter a trade.

In the example above, the RSI trendline break was a good indication that the prevailing downtrend was ending and that a new uptrend was underway.

The RSI trendline break also gives us an idea of where to place the initial stop-loss.

The stop-loss should be placed on the other side of the RSI trendline, so that if the RSI trendline is broken in the opposite direction, you know your trade was wrong and you can exit the trade.

Bottom Line: The RSI trendline method is used to gauge when the prevailing trend has ended, and a new trend is underway.

Posteingang Bild

Newsletter

Erhalte die wöchentliche E-Mail mit exklusiven Kryptoanalysen und lesenswerten Nachrichten. Bleibe informiert, völlig kostenlos.

Automatisiere
deinen
Handel!

Weltklasse automatisierter Krypto Handelsbot

Lass uns loslegen
Das Bild zeigt eine Illustration innerhalb des "Start Trading"-Banners. Die Illustration zeigt das Konzept des automatisierten Handels, wobei im Hintergrund verschiedene Finanzcharts und Indikatoren angezeigt werden. Im Vordergrund ist eine moderne und schlanke Oberfläche einer Handelsplattform zu sehen, die die Einfachheit und Bequemlichkeit des automatisierten Handels hervorhebt. Das Bild soll die Botschaft vermitteln, dass die Nutzer durch den Einsatz automatisierter Handelsstrategien ihre Handelseffizienz verbessern und möglicherweise ihre Investitionserträge maximieren können.

Verwandte Artikel

Bot Trading 101 | How To Apply a Scalping Strategy
#Automated trading strategy#Strategy designer#EMA+3 weitere Tags

Bot Trading 101 | How To Apply a Scalping Strategy

Cryptocurrencies | BTC vs. USDT As Quote Currency
#Bitcoin#crypto trading#crypto trading tips+2 weitere Tags

Cryptocurrencies | BTC vs. USDT As Quote Currency

Technical Analysis 101 | What Are the 4 Types of Indicators?

Technical Analysis 101 | What Are the 4 Types of Indicators?

Bot Trading 101 | The 9 Best Trading Bot Tips of 2023
#crypto trading#trading bot#crypto trading tips+2 weitere Tags

Bot Trading 101 | The 9 Best Trading Bot Tips of 2023

Beginne kostenlos mit dem Handel auf Cryptohopper!

Kostenlose Nutzung - keine Kreditkarte erforderlich

Los geht's
Cryptohopper appCryptohopper app

Haftungsausschluss: Cryptohopper ist keine regulierte Einheit. Der Handel mit Kryptowährungs-Bots birgt erhebliche Risiken, und vergangene Ergebnisse sind kein Indikator für zukünftige Ergebnisse. Die in den Produkt-Screenshots gezeigten Gewinne dienen nur zu illustrativen Zwecken und können übertrieben sein. Engagiere dich nur im Bot-Handel, wenn du über ausreichendes Wissen verfügst oder Beratung von einem qualifizierten Finanzberater einholst. Cryptohopper übernimmt unter keinen Umständen Haftung für (a) jeglichen Verlust oder Schaden, ganz oder teilweise, der durch Transaktionen mit unserer Software verursacht wird, oder in Zusammenhang damit entsteht, oder (b) jegliche direkte, indirekte, besondere, Folge- oder zufällige Schäden. Bitte beachte, dass der Inhalt, der auf der Cryptohopper Social-Trading-Plattform verfügbar ist, von Mitgliedern der Cryptohopper-Community generiert wird und keine Ratschläge oder Empfehlungen von Cryptohopper oder in seinem Namen darstellt. Gewinne, die auf dem Marketplace gezeigt werden, sind keine Indikatoren für zukünftige Ergebnisse. Durch die Nutzung der Dienste von Cryptohopper erkennst du die inhärenten Risiken des Kryptowährungshandels an und stimmst zu, Cryptohopper von jeglichen Haftungsansprüchen oder Verlusten freizustellen. Es ist wichtig, unsere Nutzungsbedingungen und unsere Risikohinweise zu überprüfen und zu verstehen, bevor du unsere Software verwendest oder an Handelsaktivitäten teilnimmst. Bitte konsultiere rechtliche und finanzielle Fachleute für personalisierte Ratschläge, die auf deine spezifischen Umstände zugeschnitten sind.

©2017 - 2024 Copyright by Cryptohopper™ - Alle Rechte vorbehalten.