Mastering Technical Analysis: A Guide for Traders
Welcome to the world of technical analysis! From understanding support and resistance to mastering trend analysis and technical indicators, this guide is your key to crypto trading.
Hey there, trader! Ready to delve into the exciting world of technical analysis? Well, buckle up because we're about to explore some essential concepts that can make all the difference in your trading. We're talking about support and resistance levels – those critical points on the chart where supply and demand collide, shaping the trajectory of prices.
But that's just the beginning. We'll also unravel the mysteries of trends, from bullish uptrends to bearish downtrends and everything in between.
And of course, we'll equip you with the tools you need to navigate this landscape, including insights into powerful technical indicators like the MACD, RSI, Bollinger Bands, and OBV.
So, whether you're a seasoned trader or just dipping your toes into the market, get ready to level up your trading skills.
Support and Resistance Levels
Support and resistance levels are crucial points identifiable on a chart where supply and demand intersect. Learning to identify these levels can assist traders in achieving successful entries and exits.
Support
When the demand for a cryptocurrency or another security matches the supply, the downward trend in the asset's price will halt. This point is known as support and will be tested multiple times by traders.
If the support level remains intact after numerous tests, traders are more inclined to enter long trades with confidence. However, there are instances where the support level is breached, leading to a decline in prices. In such cases, prices will continue to decline until a new support level is established. The previous support level often transforms into a new resistance level.
Resistance
Resistance levels are established when supply equals demand. In an uptrend, prices will increase until they reach a point where demand no longer exceeds supply. As prices approach this level, more traders become willing to sell.
With an abundance of supply and limited demand, a price ceiling is formed. These levels are frequently tested multiple times. Successful tests of these levels often indicate that traders are now more inclined to short the security.
However, there are occasions when prices surpass resistance and continue to rise. In such instances, prices will persist in their upward trajectory until they encounter a new resistance level. Similar to support, the former resistance level typically transitions into a new support level.
Identifying Trends
All markets exhibit trends. There are three primary trends: markets can ascend in an uptrend, descend in a downtrend, or move sideways in a channel or consolidation.
Upward Trends
Uptrends are recognized when prices achieve higher highs and higher lows. The trend can be represented on a chart by drawing an uptrend line beneath the price, connecting the lows. Some traders opt to utilize a moving average to identify the trend instead of drawing trend lines.
Downward Trends
Downtrends are recognized when prices form a succession of lower lows and lower highs. The trend line is drawn above the price by connecting the price highs. Alternatively, using moving averages instead of drawing trend lines is also acceptable.
Consolidation Trends
Occasionally, during an uptrend or downtrend, the market will fluctuate sideways within a narrow range. These are typically sluggish markets and are sometimes referred to as consolidation trends. Different trading rules are applicable to these market conditions.
Understanding Technical Indicators
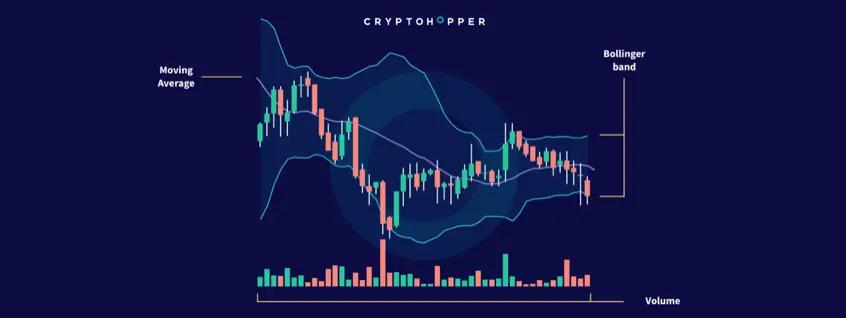
Traders utilize numerous technical indicators to acquire deeper insight into a trend. Some indicators are plotted over price, such as Bollinger Bands, while others are plotted in panels above or below price, like the moving average convergence divergence (MACD) and the relative strength index (RSI).
Additionally, there are indicators that incorporate volume, such as the on-balance volume (OBV) indicator. Regardless of their plotting method, all indicators are derived from price and/or volume. Hence, they should always be used in conjunction with price. Confirmation should consistently stem from price.
Moving Average Convergence Divergence (MACD)
The moving average convergence divergence (MACD) stands as one of the most popular and well-known indicators. Gerald Appel developed it in the late 1970s. This indicator comprises two lines:
The MACD line, representing the difference between the 12-day exponential moving average (EMA) subtracted from the 26-day exponential moving average.
The signal line, which is the nine-day EMA of the MACD.
These two lines fluctuate around a center line positioned at zero. There are no upper and lower limits to the indicator.
The MACD is commonly used for signal line crossovers. The signal line trails the MACD line. When the MACD line turns upward and crosses the signal line, it is considered bullish. Conversely, when the MACD turns downward and crosses the signal line, it is seen as bearish.
Relative Strength Index (RSI)
Another popular indicator is the relative strength index (RSI), developed by J. Welles Wilder. The RSI is bounded and fluctuates between zero and 100. It serves as a momentum oscillator that measures the speed of price movements. Default settings are 70 and 30.
When the oscillator rises above 70, the security is considered overbought. Conversely, when the RSI falls below 30, the security is deemed oversold.
Bollinger Bands
Bollinger Bands are volatility bands positioned above and below a moving average, plotted on price. They were devised by John Bollinger and are determined by standard deviation.
The bands, which frequently encompass price, expand and contract as volatility increases and decreases, respectively. They are based on +2 standard deviations above the center line and -2 standard deviations below the center line.
The interpretation of price action depends on the trading environment. In bullish conditions, trading in the direction of a price breakout often yields higher profits. Conversely, in bearish markets, shorting in the direction of the breakout is advisable.
The underlying principle of Bollinger Bands is that prices tend to revert to the mean. Periods of high volatility typically transition into periods of low volatility.
On-Balance Volume (OBV)
The on-balance volume (OBV) indicator was developed by Joe Granville to measure buying and selling pressure using volume rather than price. Granville inferred through his observations that volume precedes price movements. Therefore, the OBV represents a running total of cumulative volume.
When the volume on up days surpasses the volume on down days, the OBV increases. Conversely, when the volume on down days exceeds the volume on up days, the OBV decreases.
The Bottom Line
We've covered a lot of ground together. From the fundamentals of support and resistance levels to the intricacies of trend analysis and technical indicators, you now have a robust toolkit at your disposal.
Remember, trading isn't just about making quick profits; it's about understanding the underlying dynamics of supply and demand, recognizing patterns, and staying ahead. Whether you're a seasoned pro or just starting out, the key is to never stop learning and adapting to new market conditions.
So, as you embark on your trading journey, keep exploring, keep refining your strategies, and most importantly, keep a cool head in the face of market volatility. With dedication and perseverance, there's no limit to what you can achieve in the exciting world of trading. Happy trading, and may the markets be ever in your favor!