
You’ve already mastered trend identification (SMA/EMA), momentum shifts (MACD), overbought/oversold zones (RSI), volatility extremes (Bollinger Bands), and r eversal timing (Stochastic).
Now it’s time for VWAP, the indicator that cuts through the noise and tells you one simple thing: Are you overpaying?
What is VWAP?
VWAP stands for Volume Weighted Average Price. It shows you the average price that everyone paid today, but gives more weight to prices where lots of trading happened.
If Bitcoin had a quick spike to $110,000 but only a few people bought there, while most of the day it traded around $105,000 with significant buying and selling, VWAP will be much closer to $105,000.
The calculation is simple in concept:
Take every trade throughout the day
Multiply price × volume for each trade
Add them all up and divide by total volume
What you get is the “true” average price that reflects where most of the money actually changed hands.
How to Read VWAP:
Above VWAP = Paying More Than Most. When the price is above VWAP, you’re paying more than what most people paid today (weighted by how much they bought). This could mean:
Lots of people are buying right now, driving the price up
You might be buying when the price is temporarily high
The price might come back down to where most people bought
Below VWAP = Getting a Better Deal. When the price is below VWAP, you’re getting a better price than what most people paid today. This often means:
More people are selling than buying, pushing the price down
You might be getting a good deal compared to earlier buyers
The price might bounce back up to where most people bought
At VWAP = Paying the Average. When price trades right at VWAP, you’re paying exactly what the average person paid today, based on all the buying and selling that happened.
Big traders use VWAP to benchmark their trades. This is why VWAP often acts as support or resistance – institutional algorithms are programmed to defend these levels.
Real Example: BTC/USD on Bitfinex
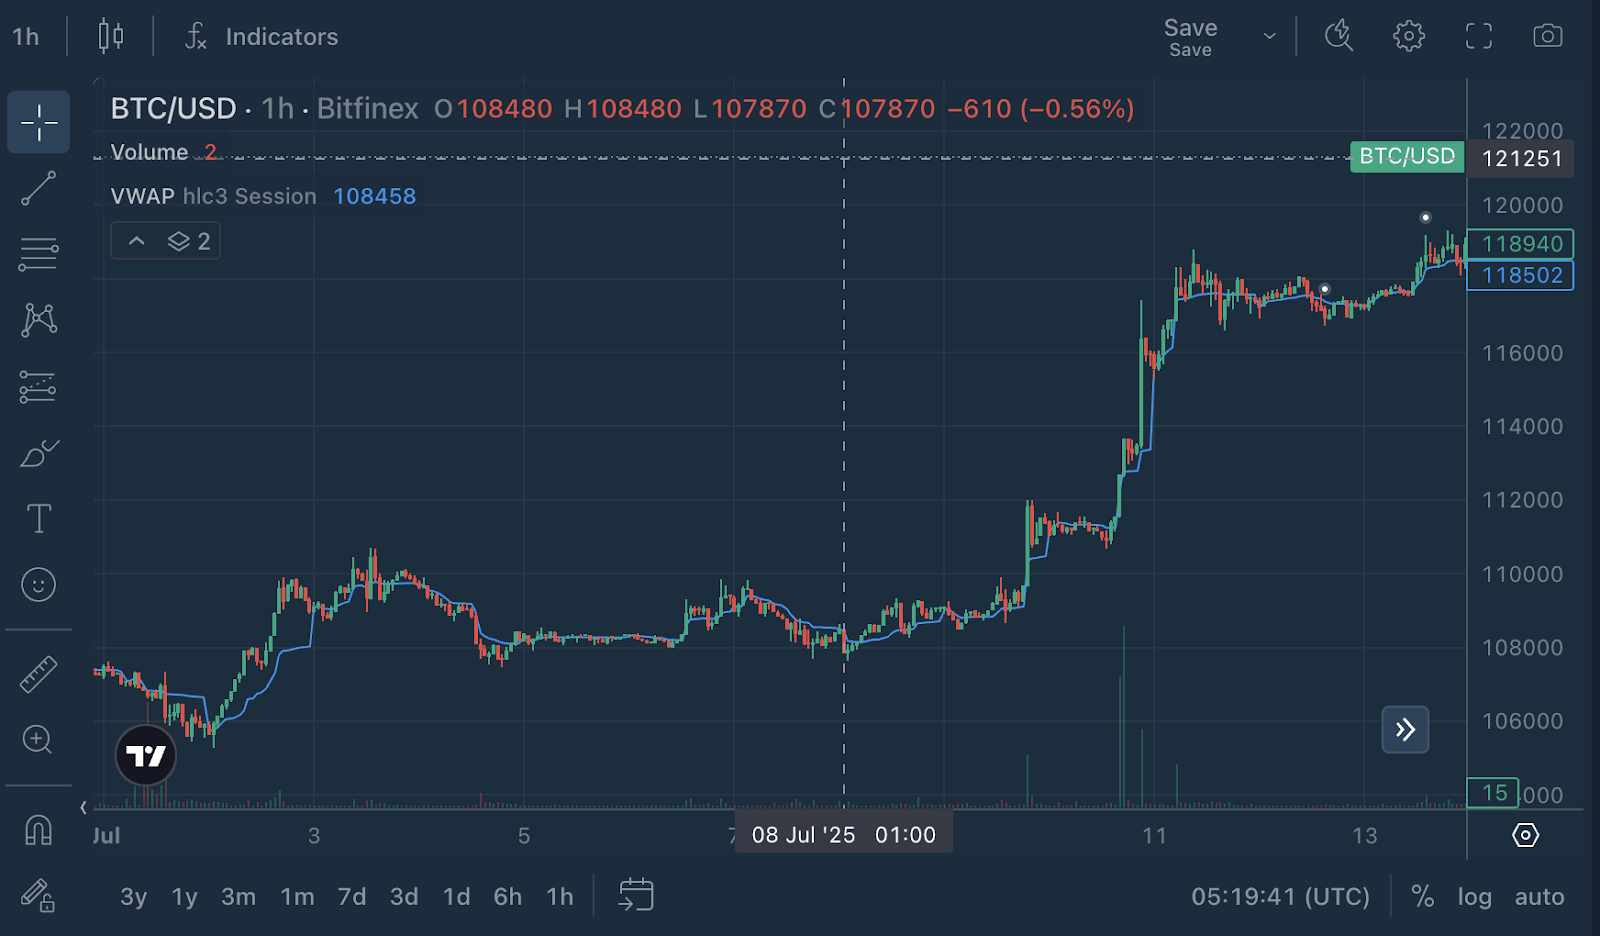
Price: $118,940
VWAP: $118,502
Bitcoin is trading above VWAP by about $438, which puts us in mild premium territory.
Trading above VWAP typically signals bullish momentum. It means that the average buyer in this session is in profit, a strong indicator that demand is currently outweighing supply. However, the premium isn’t excessive, suggesting the move is still measured rather than euphoric. A few dynamics might be at play:
Buyers are in control, but not aggressively so. It’s a sign of healthy, steady accumulation.
VWAP may act as dynamic support. Should the price retrace, the VWAP line around $118,502 could be a level where buyers step back in.
No clear discount is present at the moment. Traders looking for bargain entries may want to wait for a potential retest of VWAP.
In short, Bitcoin is currently in a balanced but bullish posture, and traders may want to watch how price behaves around VWAP to gauge whether this move has more legs — or if it’s time for a breather.
VWAP + Other Indicators: The Power Combo
VWAP works even better when combined with other tools:
VWAP + RSI: If price is above VWAP and RSI is showing overbought, that’s a strong signal you might be buying at a temporary peak.
VWAP + Volume: When price approaches VWAP with increasing volume, it often signals a significant level. Big players might be defending or testing this “fair value” line.
VWAP + Support/Resistance: VWAP often acts as dynamic support in uptrends and resistance in downtrends. It’s like a moving floor or ceiling based on where the real trading happened.
Looking at our BTC example: With price below VWAP at $111,080 vs $111,321, if we see strong buying volume as BTC approaches VWAP from below, that could signal institutional interest in defending the “fair value” line.
Bonus Read: VWAP + RSI Power Combo
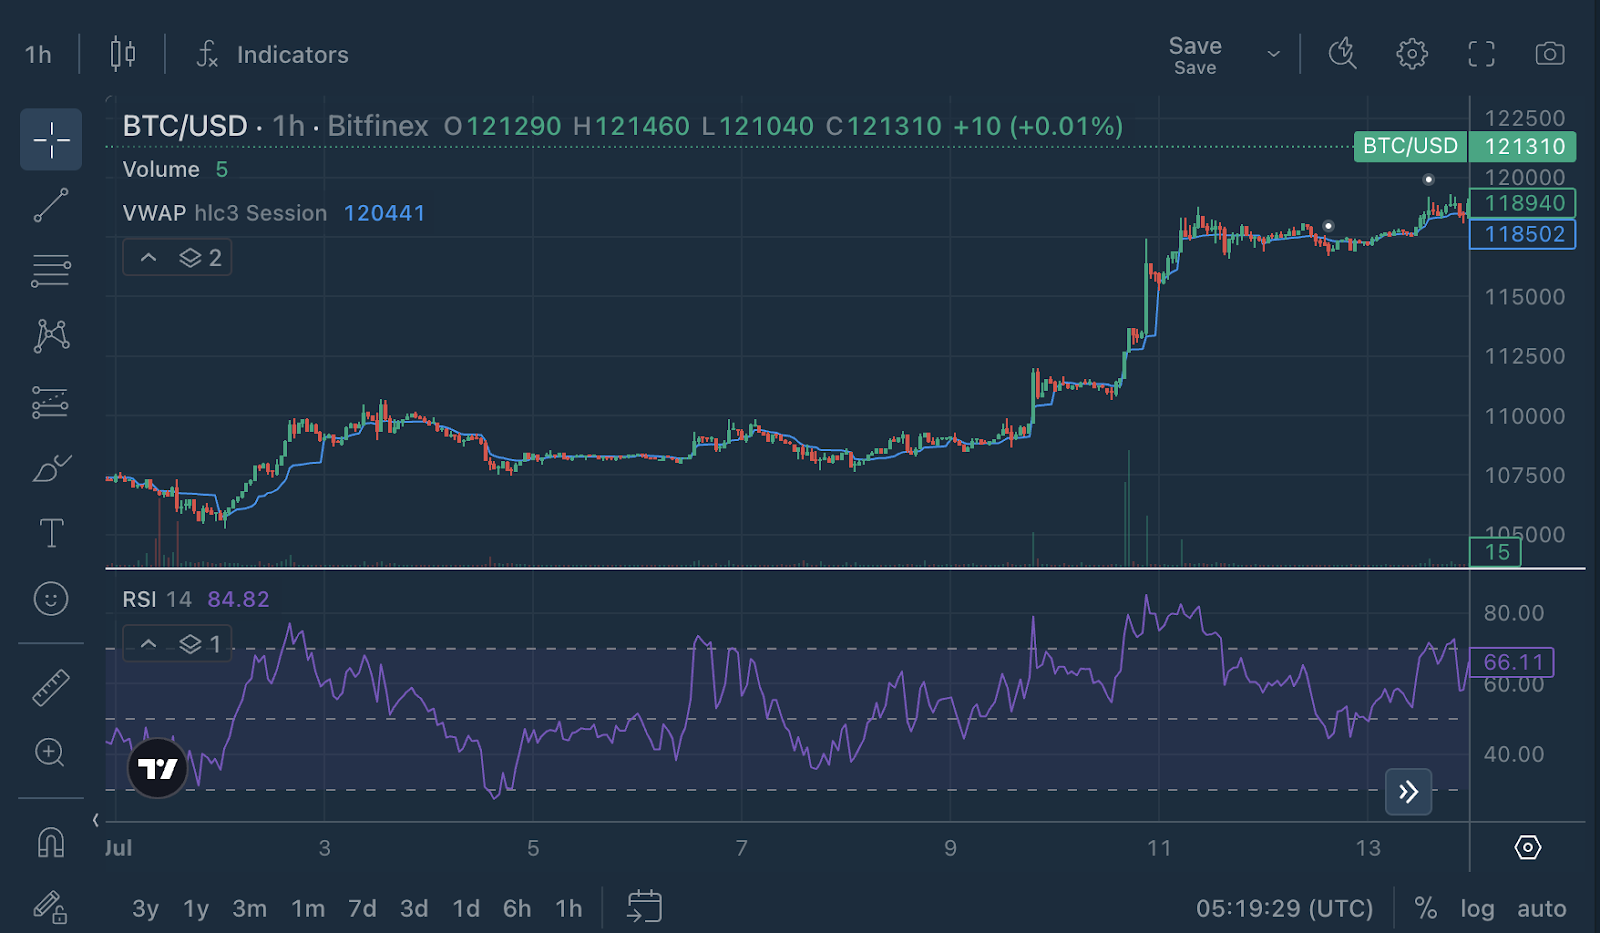
Price: $118,940
VWAP: $118,502
RSI: 66.11
This indicates Bitcoin is in bullish momentum but approaching overbought territory (RSI above 70 is typically considered overbought)
This setup is particularly interesting:
While the technical indicators are clearly bullish, the RSI’s proximity to overbought territory suggests that traders should remain alert for potential pullbacks or consolidation periods. The VWAP level at $118,502 could serve as an important support zone if the price does decide to retrace from current levels.
Overall, this combination of price action above VWAP paired with healthy RSI momentum creates a bullish environment for Bitcoin, though the approaching overbought conditions suggest that any upside moves should be monitored carefully for signs of momentum exhaustion.
Pro Tips for Using VWAP:
1. VWAP Resets Daily
Unlike moving averages that look back a set number of periods, VWAP resets at the start of each trading day. This makes it perfect for day trading and short-term decisions.
2. Don’t Fight Strong VWAP Trends
If the price is consistently above VWAP with strong volume, that’s often a sign of genuine strength. The market is saying “we’re willing to pay premium prices.”
3. VWAP Touches Are Golden
When price dips down to touch VWAP and bounces, it’s often an excellent entry point. The market is testing fair value and finding buyers.
4. Watch for VWAP Breaks
If price has been above VWAP all day then suddenly breaks below with volume, it might signal a shift in sentiment. The “fair value” line has been breached.
5. Use Multiple Timeframes
Daily VWAP: Shows you the big picture fair value
Hourly VWAP: Helps with precise entry/exit timing
Weekly VWAP: Gives you the longer-term institutional perspective
VWAP Limitations: What You Need to Know
While VWAP is a powerful tool, understanding its limitations is crucial:
Volume Dependency: VWAP needs healthy trading volume to be meaningful. In low-volume markets or during off-hours, it may not accurately reflect true fair value.
Lagging Nature: During extreme volatility, VWAP can lag behind price movements, potentially giving outdated information when you need it most.
Short-Term Focus: VWAP resets daily, making it primarily useful for intraday trading rather than long-term investment decisions.
Not Predictive: VWAP shows what happened, not what will happen. Don’t assume the price will always return to VWAP. Sometimes breakouts are genuine and sustained.
Try It on Bitfinex:
Log in to Bitfinex
Choose any chart
Add VWAP from the indicators menu
Watch how price interacts with the VWAP line
Notice the relationship between volume and VWAP
Next in the Chart Decoder Series: Volume and how to see through price action with volume confirmation.
Bitfinex. The Original Bitcoin Exchange.
The post Chart Decoder Series: VWAP – The Market’s Truth Detector appeared first on Bitfinex blog.


