
So far, you’ve learned how to spot trends (SMA/EMA), catch momentum shifts (MACD) and recognize overbought/oversold zones (RSI) and volatility extremes (Bollinger Bands).
Now let’s talk about the Stochastic Oscillator, the indicator that’s all about timing those “too much, too fast” moments.
What is the Stochastic Oscillator?
The Stochastic Oscillator measures momentum by comparing the current closing price to the high and low range over a set period (usually 14 periods).
It’s made up of two lines:
%K (Fast line): The main line, reacts quickly
%D (Slow line): A moving average of %K that smooths out the noise
You’ll typically get a reading between 0 and 100:
Above 80 (%K): Overbought. Market might need a breather
Below 20 (%K): Oversold. A bounce could be coming
Between 20–80: Neutral. Price is moving within its recent range
Signal Crossovers
%K crosses above %D below 20: Bullish reversal signal
%K crosses below %D above 80: Bearish reversal signal
If both lines are stuck above 80 or below 20: Strong trend, but it’s also a warning not to overstay your welcome. These zones often precede a shift.
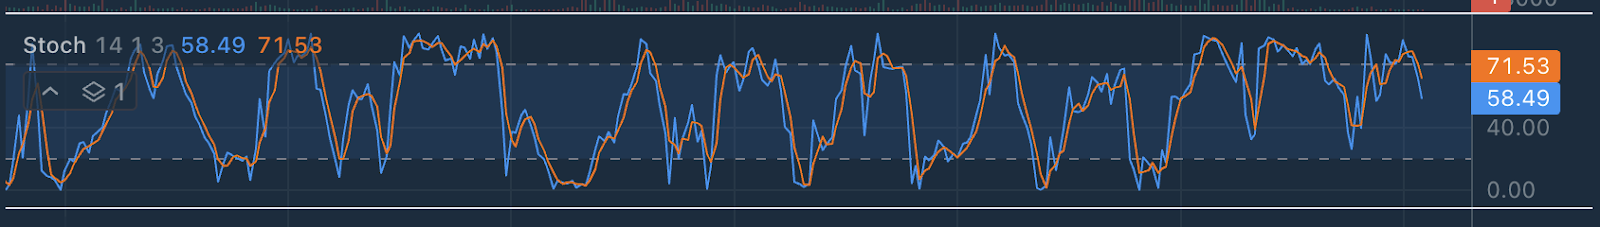
BTC/USD Example on Bitfinex
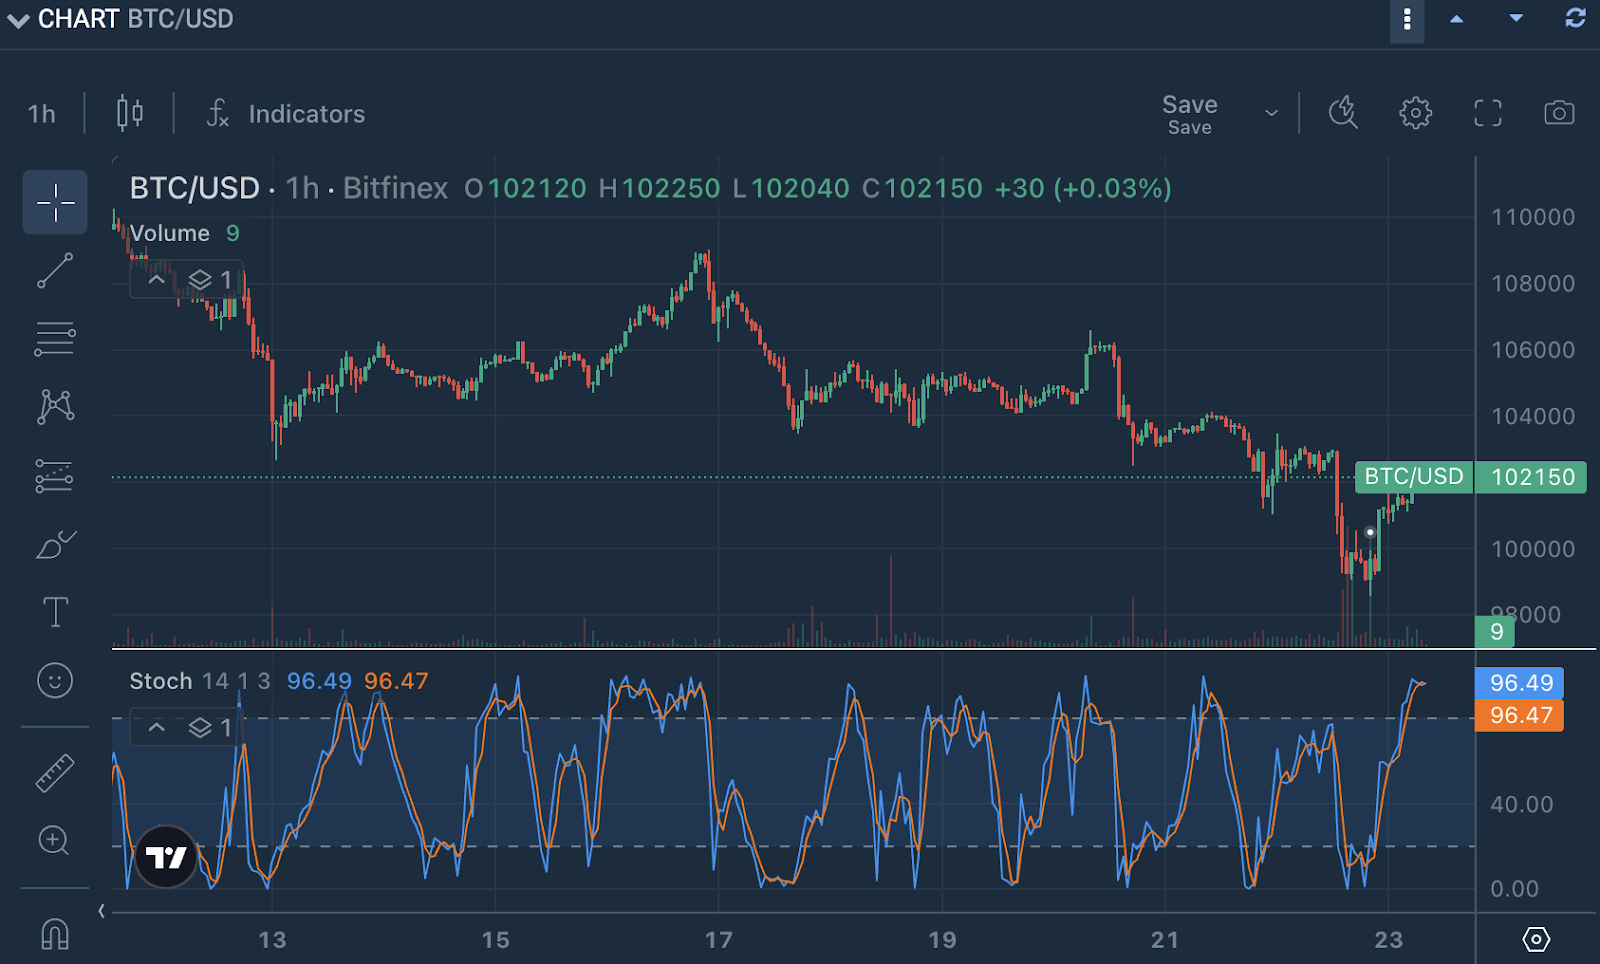
Price: $102,150.
Blue (K%): 96.49
Orange (D%): 96.47
Both lines are in the overbought zone (above 80), which often signals potential exhaustion of the current upward move.
The recent pump might be overdoing it. When Stochastic readings get this high, it often signals that buyers may be running out of gas, and a pullback could be around the corner.
But here’s the twist: overbought doesn’t mean “time to sell”, especially in crypto. In strong trends, momentum indicators like Stochastic can stay high for a while. So, we need more clues before making a call.
What Other Indicators Can Help?
While the Stochastic Oscillator gives you a quick read on momentum extremes, it works even better when paired with other tools.
Exponential Moving Averages (EMAs) like the 50 or 200 can help you zoom out. If BTC is bouncing but still trading below the 200 EMA, it could just be a short-lived relief rally rather than a true trend reversal.
MACD acts like a momentum compass. If Stochastic is saying overbought but the MACD is crossing upward and gaining strength, that might mean the move has more room to run.
RSI, on the other hand, is a close cousin of Stochastic. It also flags overbought and oversold zones, but with a smoother, slower approach. It’s great for confirming if momentum is building or fading. Used together, RSI and Stochastic give you both direction and timing. One shows where the market’s leaning. The other tells you when it might snap back.
RSI vs. Stochastic – What’s the Difference?
Both show if a coin is “overbought” or “oversold,” but they work differently:
| Feature | RSI | Stochastic |
| Best at | Measures how strong the recent price move is. Confirming big trends or breakouts | Shows if price is near the top or bottom of range. Catching short-term reversals |
| Reading range | 0 to 100 | 0 to 100 |
| Too high (Overbought) | Above 70 | Above 80 |
| Too low (Oversold) | Below 30 | Below 20 |
| Reaction speed | React more slowly, better for trend strength | Reacts quickly, better for short erm timing |
Bonus Read: When We Added RSI to the Mix
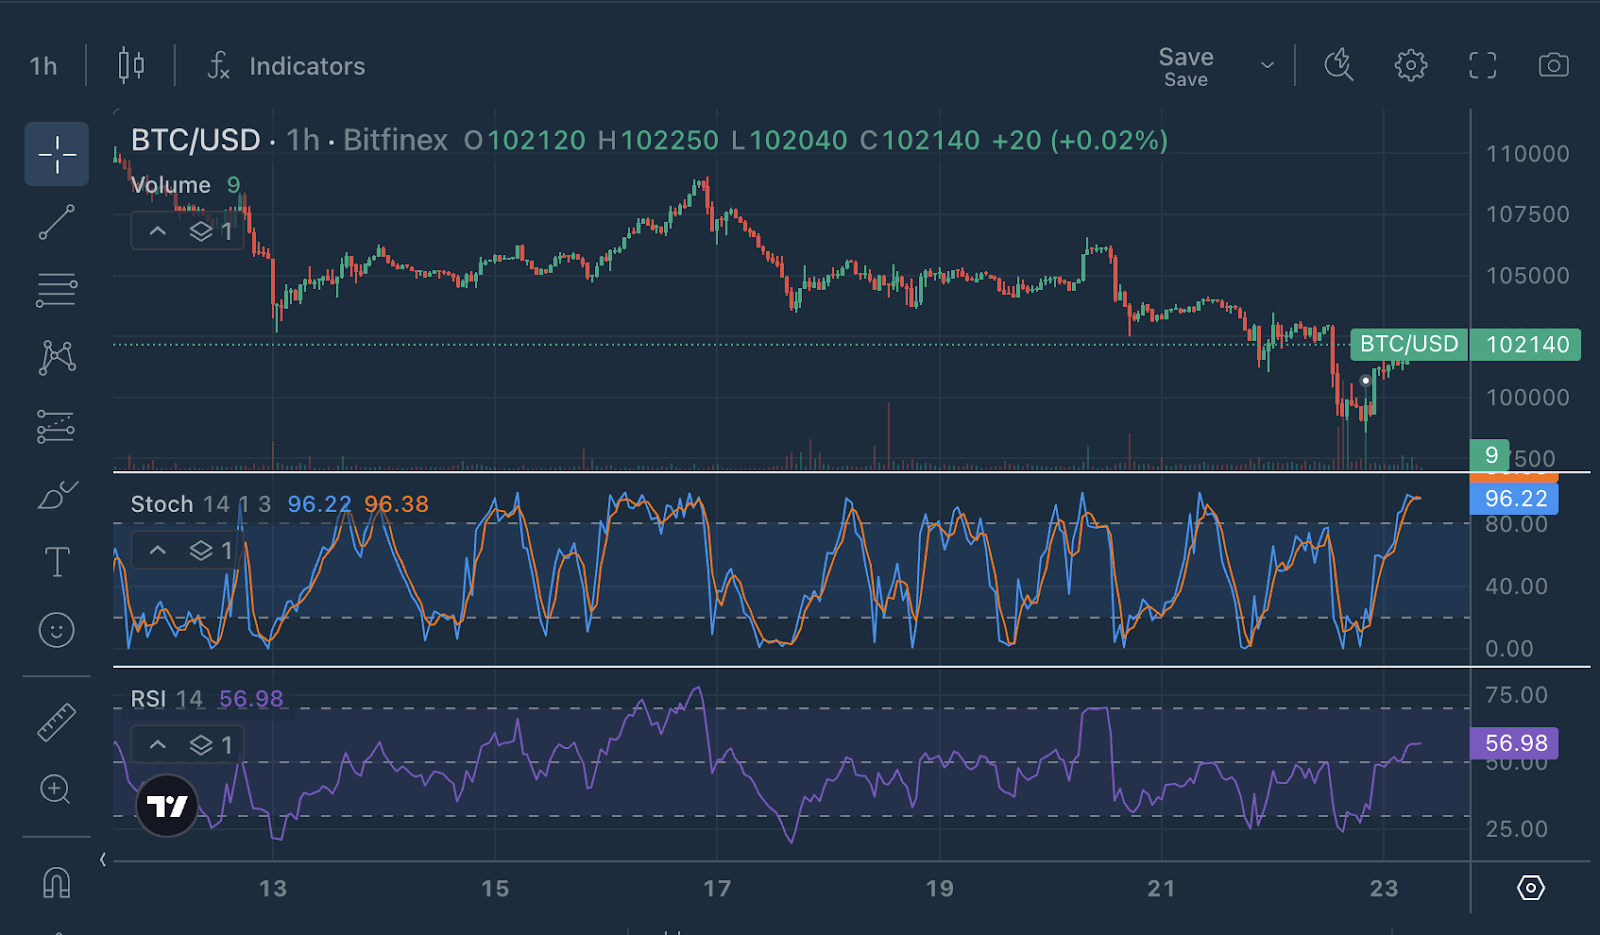
To double-check the Stochastic signal, we layered in the RSI (14) on the same BTC/USD chart. Here’s what we saw:
Stochastic was flashing overbought at 96+.
RSI is sitting comfortably around 56.98, right in the neutral zone.
This divergence is interesting. While Stochastic says “momentum’s peaking,” RSI suggests there’s still room to move higher before the trend runs out of steam.
That mismatch can often indicate short-term indecision or even a chance of continuation, especially if volume kicks in.
So what’s the move? If RSI breaks past 60 or 70 with the price holding firm, we might see this rally push further. But if RSI stalls and Stochastic crosses down, that might be your early warning light.
How to Use the Stochastic Like a Pro:
Confirmation is key: Never rely on Stochastic alone. Wait for crossovers, and check RSI or MACD for agreement.
Don’t panic on every signal: Overbought can stay overbought in a raging bull market.
Look for divergence: If price makes a new high but Stochastic doesn’t, momentum is fading, a reversal could be coming.
Multiple timeframes: A 15-minute chart signal means little if the daily is still trending.
Try It on Bitfinex:
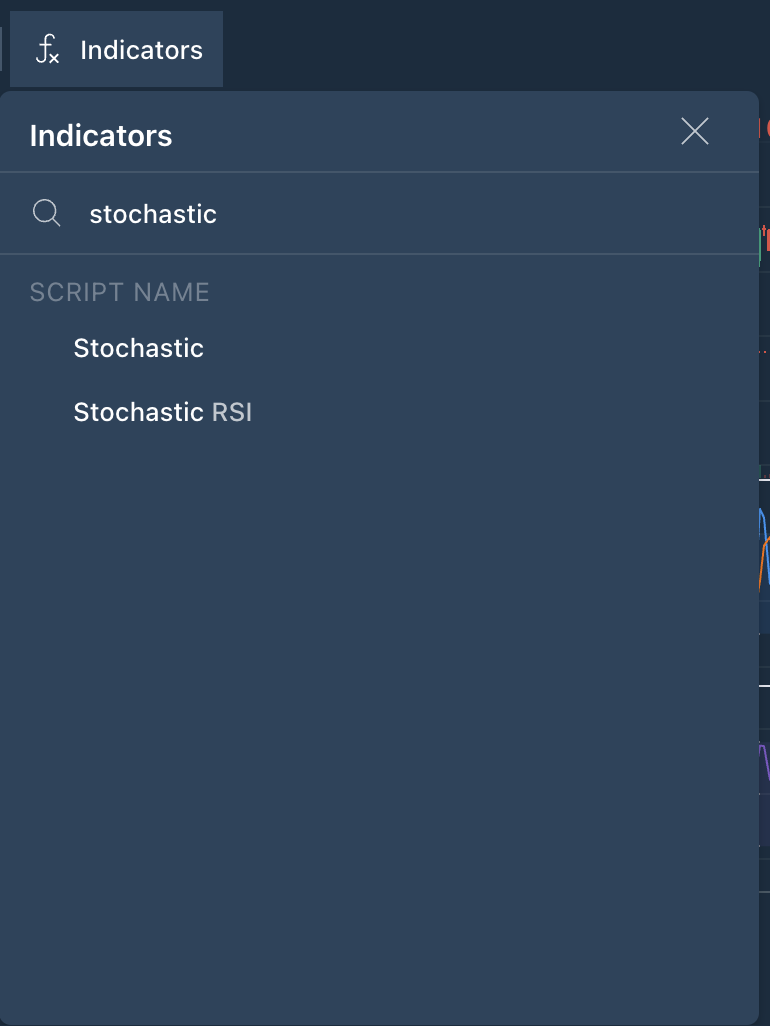
Log in to Bitfinex
Choose any chart
Add the Stochastic Oscillator
Watch for crossovers at the extremes
Next in the Chart Decoder Series: VWAP and how to tell if price is above or below “fair value.”
Bitfinex. The Original Bitcoin Exchange.
The post <strong></strong> appeared first on Bitfinex blog.


