Navigating Crypto Charts: Insights into Price Action and Market Dynamics
In cryptocurrency trading, mastering charts is crucial. From basic line charts to detailed candlestick patterns, they offer vital insights into market dynamics. Explore our guide for an overview of chart types, key parameters, and where to find reliable charting tools, essential for navigating the volatile cryptocurrency market.
In the fast-paced world of cryptocurrency trading, charts serve as the primary compass for navigating market trends and making informed decisions. These visual representations of price action come in various forms, each offering unique insights into the dynamics of digital asset trading.
From the foundational simplicity of line charts to the intricate patterns revealed by candlestick charts, understanding these chart types is essential for both novice and seasoned traders alike.
In this blog, we delve into the anatomy of line, bar, and candlestick charts, uncovering their origins, characteristics, and applications in the realm of cryptocurrency trading.
Additionally, we'll examine the key parameters displayed on crypto charts and where to find reliable charting tools, equipping you with the knowledge needed to decipher market movements and navigate the exciting landscape of cryptocurrency investing.
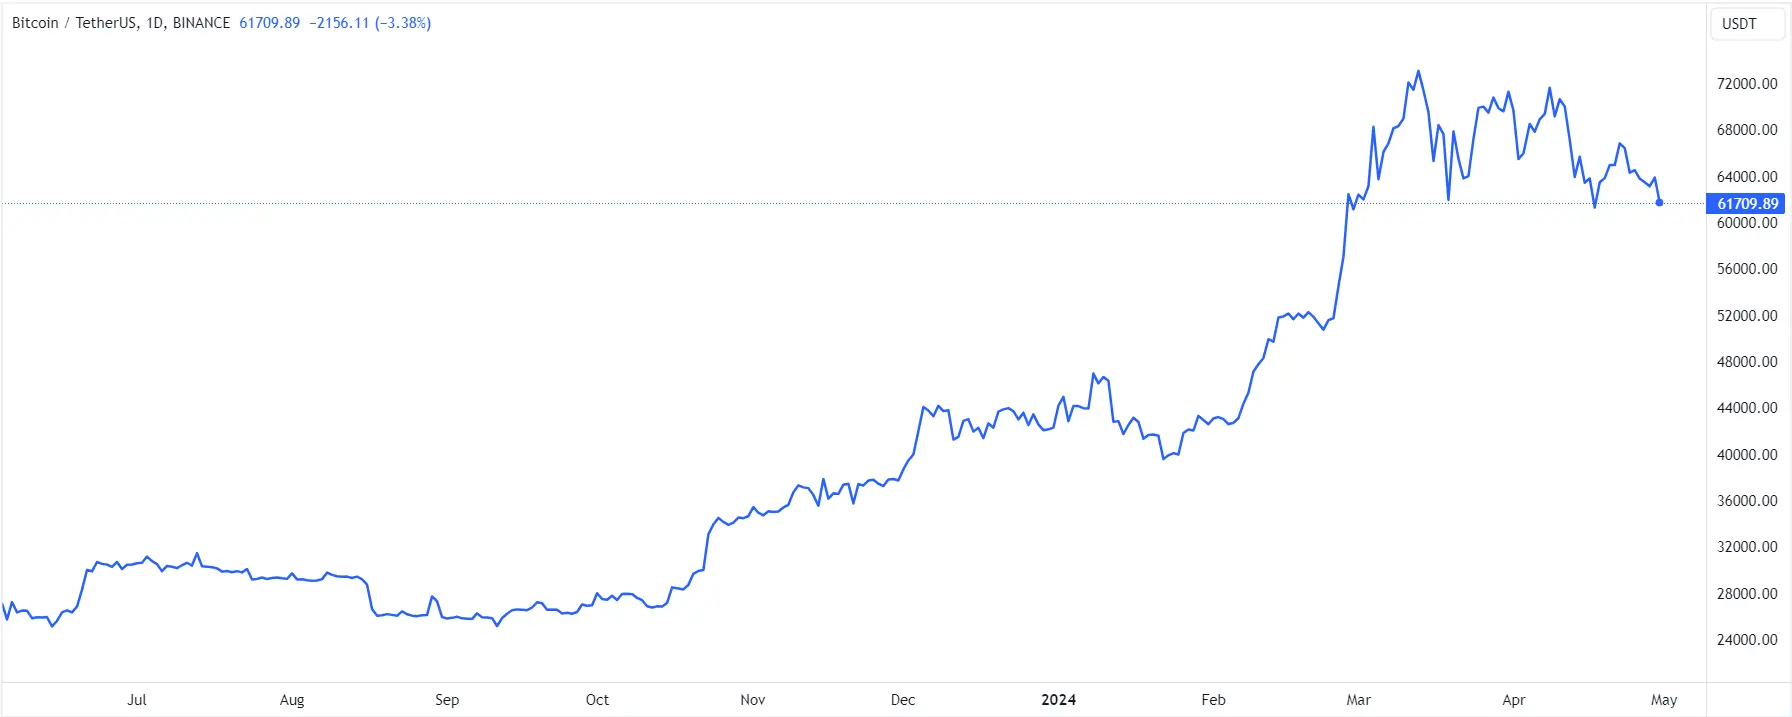
Line Charts
Line charts represent the most fundamental type of chart utilized in technical analysis. They typically rely on only one data point: the closing price. To ascertain the trend, a sequence of closing prices is plotted on a chart and connected to form a line.
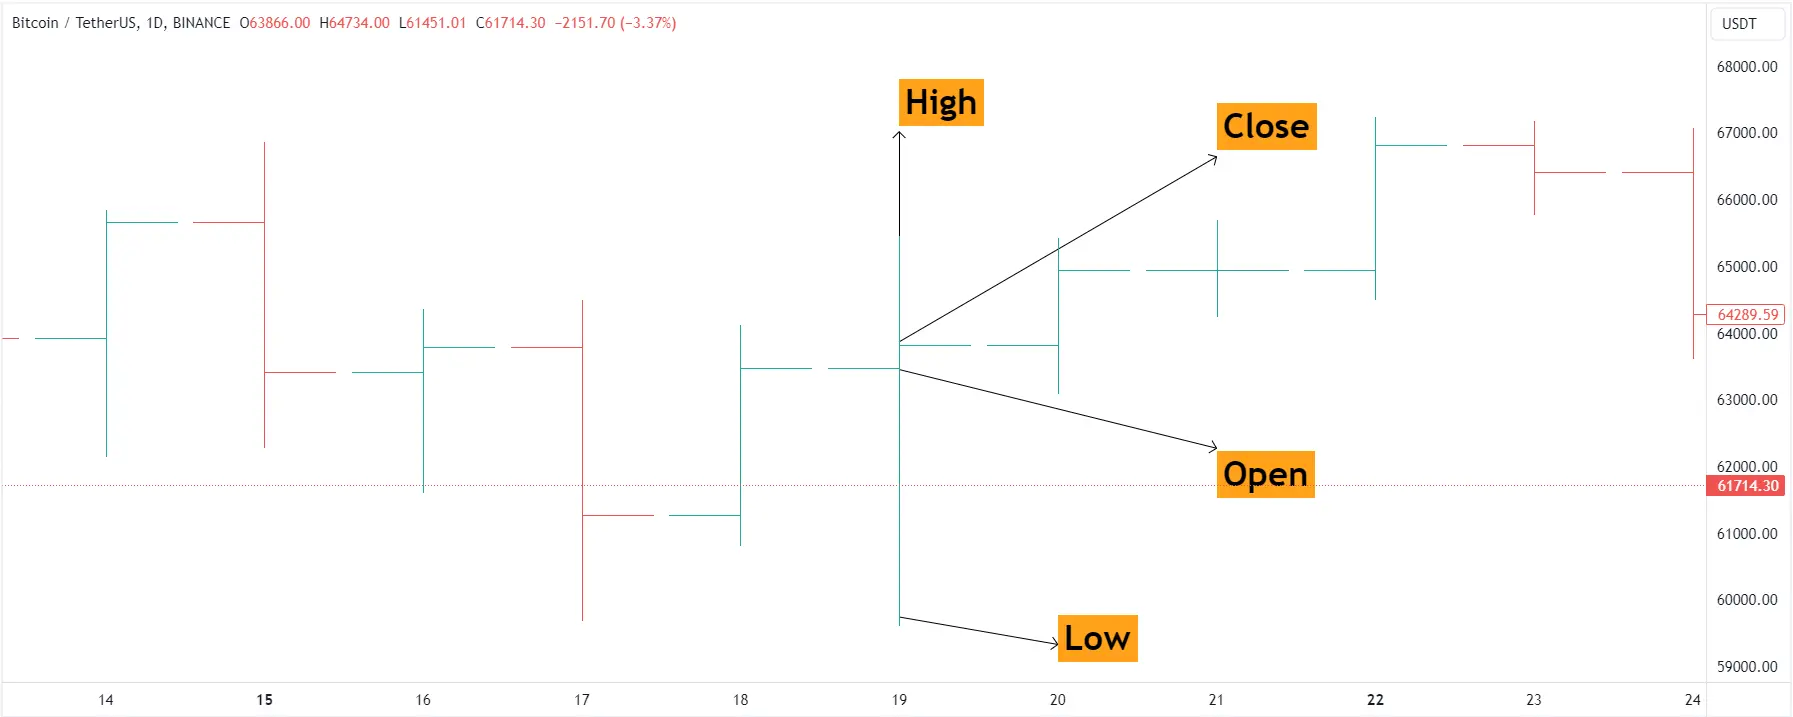
Bar Charts (Open High Low Close Chart)
Bar charts encompass more information than line charts. Each bar plotted on a chart incorporates the open, high, low, and close prices. These charts are commonly referred to as OHLC (open, high, low, close) charts.
Candlestick Charts
These charts originated in Japan in the 1700s and were initially employed by rice merchants. They were introduced to the West by Steven Nison in his book Japanese Candlestick Charting Techniques.
Similar to bar charts, candlesticks utilize the open, high, low, and close prices, but their representation is more visual and has gained significant popularity among traders. Indeed, candlestick charts are one of the most favored chart types in the West and are accessible on all trading platforms.
Candlesticks are favored by cryptocurrency traders and are applied in the same manner as they are for other securities. For short-term traders, there are charting services that offer time frames ranging from intervals as brief as one-minute charts to various intervals up to daily charts.
For longer-term traders, daily, weekly, and monthly charts are most important.
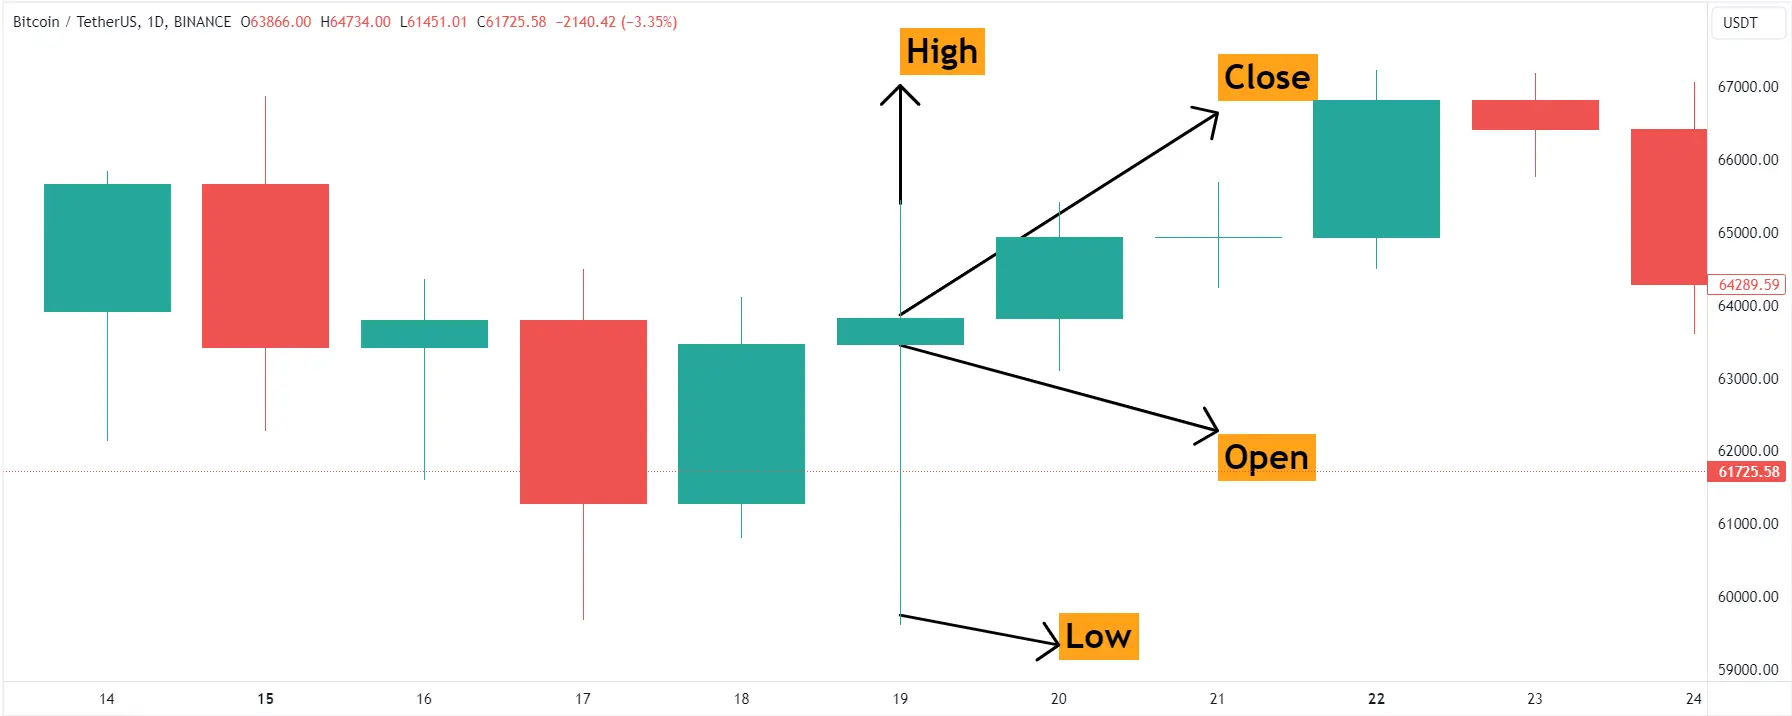
Each candle consists of two parts: the body and the shadows, or "wicks." The body indicates the distance between the opening and closing prices of the cryptocurrency in a given time interval.
The top wick illustrates the highest price of the cryptocurrency during that time interval, while the bottom wick reveals the lowest price of the cryptocurrency within the same time frame.
A candlestick can either be bearish, depicted as a red-colored candlestick, or bullish, represented as a green candlestick. A bullish candlestick has a closing price higher than its opening price, whereas a bearish candlestick has an opening price higher than its closing price.
When interpreted correctly, candlestick crypto charts can assist you in identifying patterns in market trends, enabling you to anticipate potential future outcomes.
What Exactly Does a Crypto Chart Show?
Investing in cryptocurrencies requires an understanding of the data displayed on a crypto chart. There are several basic parameters to consider when evaluating the performance of a cryptocurrency.
Price: Checking the price of a cryptocurrency is the initial step in assessing its performance. Comparing price movements across various timeframes, such as days, weeks, months, years, and all-time, is essential for informed investment decisions.
Market Cap: The market capitalization of a cryptocurrency is determined by multiplying the price of each token by the number of circulating coins. Comparisons can be made with data from recent days, weeks, and years.
Trading Volume: This metric refers to the frequency with which a coin changes hands within a specific period. An increase in trading volume indicates rising interest in the coin.
Hashrate: This measures the speed of cryptocurrency mining, indicating how many calculations can be completed per second in units of hash/second. A higher hashrate signifies a larger number of miners verifying transactions, enhancing the security of the cryptocurrency.
Circulation Supply: Circulation supply refers to the number of coins or tokens actively traded and utilized in the market. If the supply is high and demand is low, the price of coins may depreciate. Understanding circulation supply is crucial for assessing market dynamics.
Where to Find Crypto Charts
Once you grasp the basics of reading a chart, the next step is learning where to locate crypto chart tools and what to look for.
TradingView
TradingView is a well-known website where crypto companies and investors can access live trading charts for crypto. Both a free version and a premium version are available on the website.
Coinigy
Coinigy provides features that aid investors in understanding market sentiment. It operates as a cloud-based platform and offers data from various cryptocurrency exchanges. Coinigy offers a free plan as well as several paid options.
Cryptohopper
At Cryptohoper we have integrated Tradingview’s chart and you can trade cryptocurrencies automatically using Tradingview’s charts.
The Bottom Line
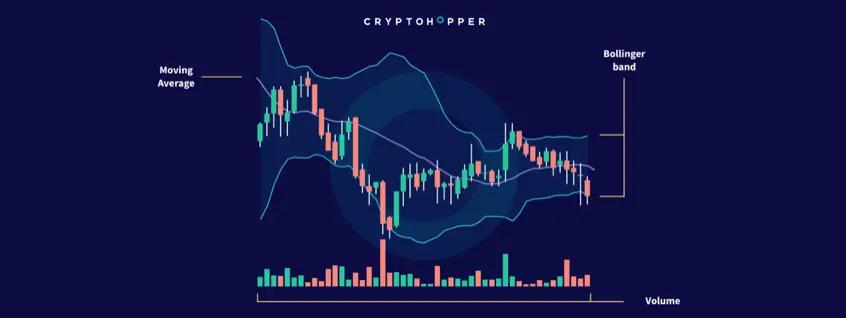
Charts are invaluable tools for technical analysts, offering visual insights into price action. Line, bar, and candlestick charts each provide different levels of detail, with candlestick charts being particularly favored for their clarity and ability to reveal market sentiment.
Understanding candlestick components and patterns is essential for cryptocurrency traders to anticipate future outcomes.
When assessing cryptocurrency charts, factors like price, market capitalization, trading volume, hashrate, and circulation supply are crucial. Platforms like TradingView, Coinigy, or Cryptohopper offer real-time data and advanced analytical tools for informed decision-making in the crypto market.