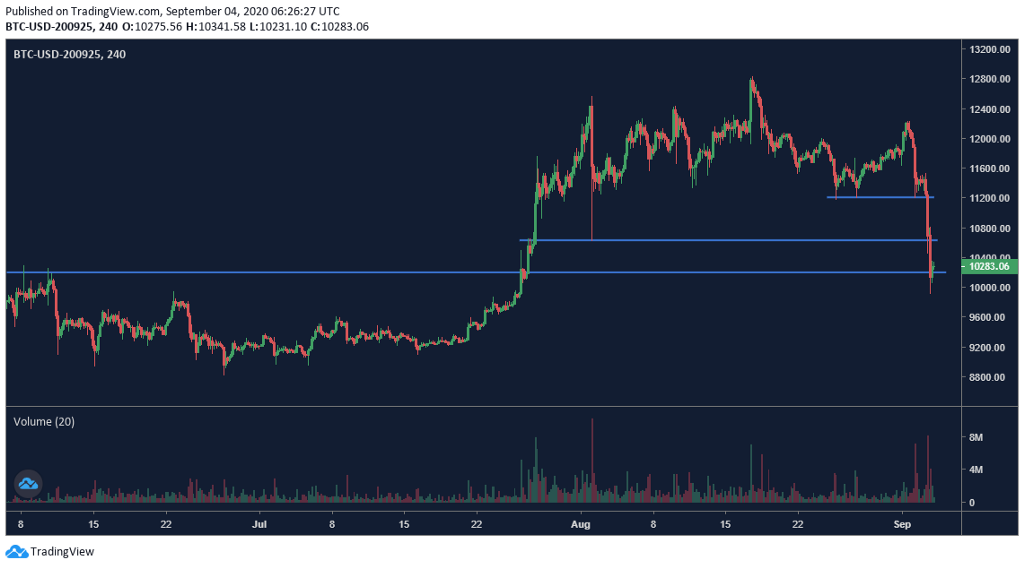
From last Friday to this Tuesday, the ultra-high return of yield-farming projects in decentralized finance sent the price of Ether (ETH) soaring, which also helped Bitcoin. However, on Wednesday, a sharp drop in the price of gold resulted in a bearish engulfing pattern forming on Bitcoin’s daily chart. Since then, BTC’s price has continued to slide and finally broke below $10,500 as U.S. stocks also saw a significant correction on Thursday.
The OKEx Quarterly Futures ( BTCUSD0925) saw the price drop to as low as $9,902 and was, at one point, trading below the spot price, fully reflecting the market’s short-term pessimism. Moving forward, the $10,000 mark will be an important psychological level for the market.
Looking at OKEx trading data, the long/short ratio is still above 1.2, indicating that some longs are still holding their positions expecting to reduce losses on a price rally. However, the quarterly futures price, which was once at a negative premium, illustrates the market’s negativity.
Open interest has returned to where it was in late July when the price broke above $10,000, which also indicates that profit-taking bears have mostly closed out their positions. With the $10,000 mark very close to the current price, we will likely see a period of consolidation.
OKEx trading data readings
Visit OKEx’s trading data page to explore more indicators
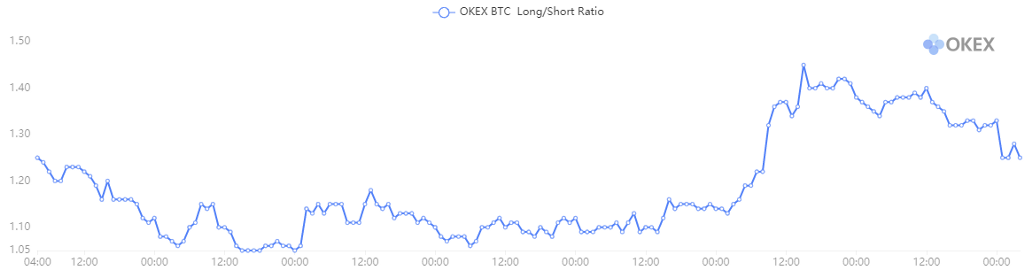
BTC long/short ratio
As for the long/short ratio, it remained low throughout the price surge from Friday to Monday, running between 1.05 and 1.20. This indicates that the number of traders chasing the price rally was not large.
However, on Wednesday, as the quarterly futures price fell from $12,000 to $11,300, we could clearly see a spike in the long/short ratio, jumping from 1.20 to 1.45. This also shows that many traders were taking long positions on the way down. But those long holdings were completely crushed on Thursday when the price fell further to around $10,200.
The long/short ratio compares the total number of users opening long positions versus those opening short positions. The ratio is compiled from all futures and perpetual swaps, and the long/short side of a user is determined by their net position in BTC. In the derivatives market, whenever a long position is opened, it is balanced by a short position. The total number of long positions must be equal to the total number of short positions. When the ratio is low, it indicates that more people are holding shorts.
The ratio has now retreated from a high of 1.45 to around 1.25, indicating that the price drop was very sudden and the number of short-sellers is still low, while many bulls are carrying their bags expecting a rebound.
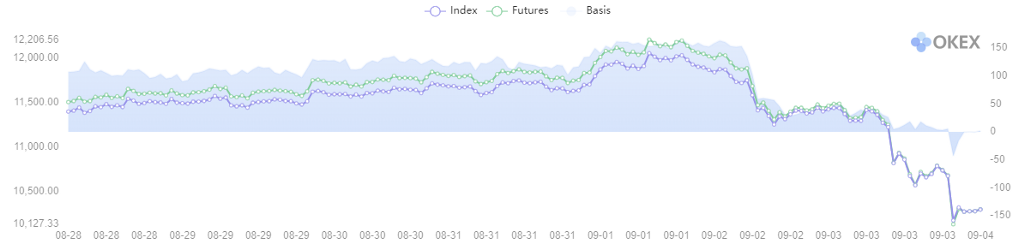
BTC basis
In last week’s Futures Friday article, we stated that the “BTC basis shows that the market is not as optimistic as it was earlier this month.”
This indicator shows the quarterly futures price, spot index price and also the basis difference. The basis of a particular time equals the quarterly futures price minus the spot index price. The price of futures reflects the traders’ expectations of the price of Bitcoin. When the basis is positive, it indicates that the market is bullish. When the basis is negative, it indicates that the market is bearish. The basis of quarterly futures can better indicate the long-term market trend. When the basis is high (either positive or negative), it means there’s more room for arbitrage.
In the last seven days, the premium on OKEx Quarterly Futures had risen to $160 from $110 before Wednesday’s pullback. The premium has now been wiped out in two consecutive days of steep declines and entered negative territory at one point. This is the first time since mid-May that the quarterly futures saw a negative premium, which is indicative of extremely pessimistic market sentiment. The current quarterly futures price has become almost identical to the spot price.
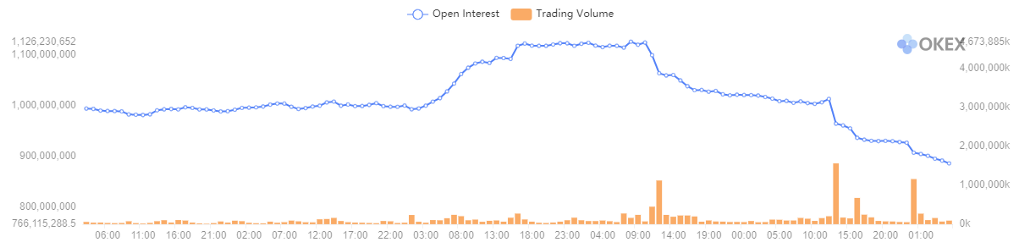
Open interest and trading volume
Open interest moved almost the same way as price, peaking at $1.12 billion for the week before falling on Wednesday. And OI is now down to $886 million after two days of continued selloffs and liquidations.
Open interest is the total number of outstanding futures/swaps that have not been closed on a given day. Trading volume is the total trading volume of futures and perpetual swaps over a specific period of time. If there are 2,000 long contracts and 2,000 short contracts opened, the open interest will be 2,000. If the trading volume surges and the open interest decreases in a short period of time, it may indicate that a lot of positions are closed, or were forced to liquidate. If both the trading volume and open interest increase, it indicates that a lot of positions have opened.
The rapid decline in OI also indicates that the bears closed out their positions during the drop. However, combined with the long/short ratio, it appears there are still many bulls that are in loss but have not closed their long positions.
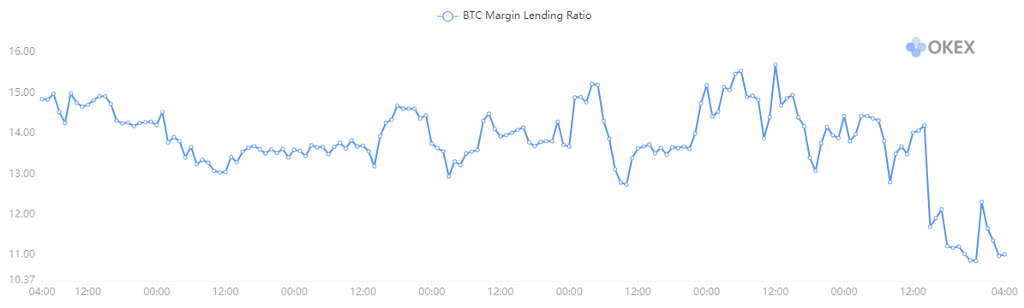
BTC margin lending ratio
The margin lending ratio changed little during most of the week, hovering between 13 and 15. However, it finally slipped quickly to around 11 during Thursday’s selloff, indicating that many long traders who borrowed USDT have closed their positions in a loss.
The margin lending ratio This ratio also helps traders to look into market sentiment. Generally, traders borrowing USDT aim to buy BTC, and those borrowing BTC aim to short it. When the margin lending ratio is high, it indicates that the market is bullish. When it is low, it indicates that the market is bearish. Extreme values of this ratio have historically indicated trend reversals. is spot market trading data showing the ratio between users borrowing USDT versus borrowing BTC in USDT value over a given period of time.
However, with the ratio still clearly above 1.0, the spot margin trading market has been relatively slow to react and is still not out of the previous bull market inertia.
Trader insight
Robbie, OKEx Investment Analyst
This recent selloff was mostly influenced by traditional markets, especially profit-taking after the V-shaped reversal in various assets. We need to pay particular attention to the last trading day of the week for the United States stock market and the U.S. Dollar Index.
Visit https://www.okex.com/ for the full report.
Disclaimer: This material should not be taken as the basis for making investment decisions, nor be construed as a recommendation to engage in investment transactions. Trading digital assets involve significant risk and can result in the loss of your invested capital. You should ensure that you fully understand the risk involved and take into consideration your level of experience, investment objectives and seek independent financial advice if necessary. OKEx Insights presents market analyses, in-depth features, original research & curated news from crypto professionals.
Not an OKEx trader? Learn how to start trading!

was originally published in OKEx Blog on Medium, where people are continuing the conversation by highlighting and responding to this story.