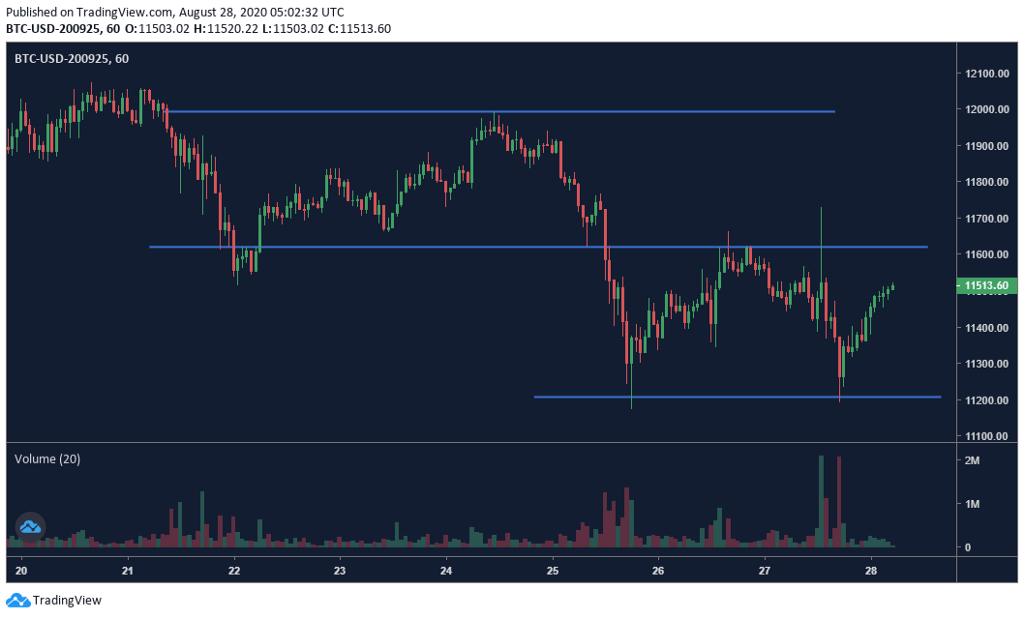
Notably, Bitcoin’s moves over the last week have remained closely tied to gold, but its pullback was significantly bigger. Compared to last Friday’s opening price, gold is currently down just under 0.5%. Bitcoin, however, has fallen 4% in the same period.
Moreover, bears have largely dominated the Bitcoin market this week, even dampening the DeFi mania, somewhat, where we saw related tokens drop in tandem with Bitcoin on Tuesday.
Looking at OKEx trading data, open interest peaked on Monday with the rally in price, and as the longs closed their positions, the BTC price moved down. After the price hit around $11,200 in the second half of the week, we saw a rapid increase in the long/short ratio, suggesting that retail traders were buying at lower levels.
However, the level of premiums in quarterly futures continued to decline this week, indicating that while the market remains optimistic, it does not expect much in the way of price appreciation.
OKEx trading data readings
Visit OKEx trading data page to explore more indicators
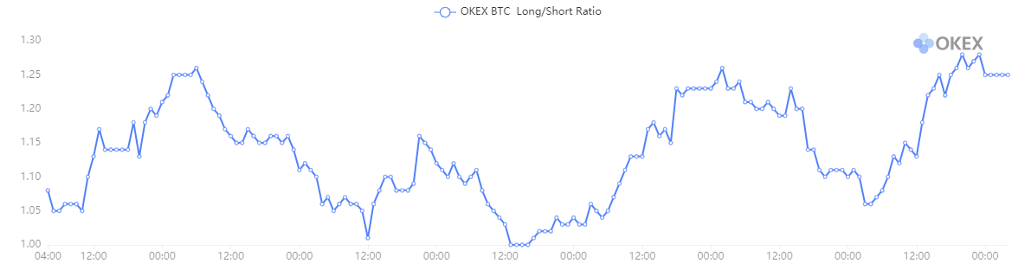
BTC long/short ratio
This week’s movement in the long/short ratio is closely related to price — i.e., the long/short ratio rose quickly after the price bottomed out and fell as the price went up. Overall, the ratio was running in the range of 1.0 to 1.3 this week and is oscillating rapidly.
On Monday, we saw the long/short ratio reach its lowest of the week at 1.0, which corresponded with Bitcoin’s weekly high. Meanwhile, the ratio reached its highest point of the week around 1.3 on Thursday and Friday night, when the price also happened to touch the bottom twice. This indicates that retail traders bought in and didn’t fear the price drop.
The long/short ratio compares the total number of users opening long positions versus those opening short positions. The ratio is compiled from all futures and perpetual swaps, and the long/short side of a user is determined by their net position in BTC. In the derivatives market, whenever a long position is opened, it is balanced by a short position. The total number of long positions must be equal to the total number of short positions. When the ratio is low, it indicates that more people are holding shorts.
The current long/short ratio is sitting at 1.25, which also indicates that retail traders remain optimistic about the short-term market.
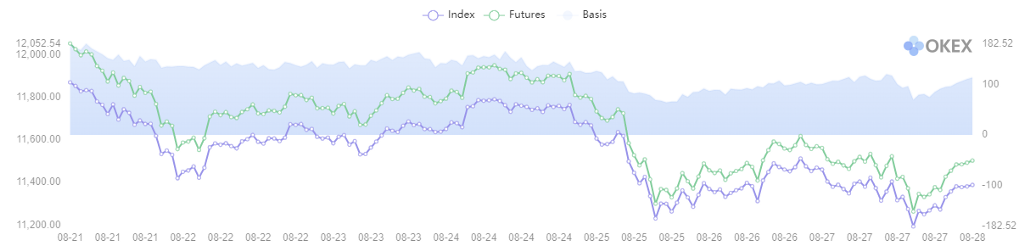
BTC basis
The premium on OKEx Quarterly Futures narrowed again from last Friday’s $180 to the current $110. This number was at a high of $350 two weeks ago, reflecting the shift in sentiment since then.
This indicator shows the quarterly futures price, spot index price and also the basis difference. The basis of a particular time equals the quarterly futures price minus the spot index price. The price of futures reflects the traders’ expectations of the price of Bitcoin. When the basis is positive, it indicates that the market is bullish. When the basis is negative, it indicates that the market is bearish. The basis of quarterly futures can better indicate the long-term market trend. When the basis is high (either positive or negative), it means there’s more room for arbitrage.
Since the current quarterly contract will expire at the end of September, the reduction in the premium is also affected by the time decay, but it still shows that the market is not as optimistic as it was earlier this month.
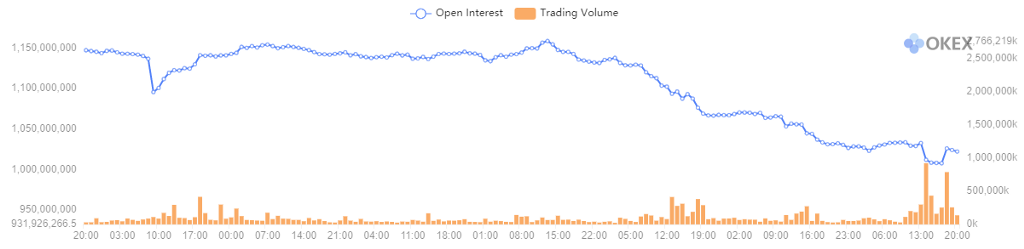
Open interest and trading volume
Open interest peaked at $1.16 billion on Monday afternoon before sliding to the current $1.02 billion as the price declined.
While we have seen continued liquidations of long positions, the sharp decline in OI gives reason to believe that short positions were also being closed in the second half of the week.
Open interest is the total number of outstanding futures/swaps that have not been closed on a given day. Trading volume is the total trading volume of futures and perpetual swaps over a specific period of time. If there are 2,000 long contracts and 2,000 short contracts opened, the open interest will be 2,000. If the trading volume surges and the open interest decreases in a short period of time, it may indicate that a lot of positions are closed, or were forced to liquidate. If both the trading volume and open interest increase, it indicates that a lot of positions have opened.
Moreover, the increase in trading volume did not lead to an increase in OI, which also suggests that there is currently an exchange of hands taking place in the market, and the direction is not clear.
BTC margin lending ratio
Compared to the long/short ratio, the BTC margin lending ratio has changed relatively little this week. It reached a high of 16.6 during the rise in the price of Bitcoin on Saturday, and then began to gradually decline.
The margin lending ratio This ratio also helps traders to look into market sentiment. Generally, traders borrowing USDT aim to buy BTC, and those borrowing BTC aim to short it. When the margin lending ratio is high, it indicates that the market is bullish. When it is low, it indicates that the market is bearish. Extreme values of this ratio have historically indicated trend reversals. is spot market trading data showing the ratio between users borrowing USDT versus borrowing BTC in USDT value over a given period of time.
Visit https://www.okex.com/ for the full report.
Disclaimer: This material should not be taken as the basis for making investment decisions, nor be construed as a recommendation to engage in investment transactions. Trading digital assets involve significant risk and can result in the loss of your invested capital. You should ensure that you fully understand the risk involved and take into consideration your level of experience, investment objectives and seek independent financial advice if necessary. OKEx Insights presents market analyses, in-depth features and curated news from crypto professionals.
We saw longs being closed and a rapid decline in OI during Bitcoin’s midweek decline to $11,200. While retail investors started to go long after bottoming out, the overall sentiment still hasn’t improved significantly and we can expect another period of sideways consolidation.
The short-term trend is that of a W-shaped rebound, and given how the long/short ratio has continued to rise, the bullish sentiment is still alive. If the price can stay above the $11,600 resistance level, we may see another leg up to test $12,000, which is the ceiling, for now.
Not an OKEx trader? Learn how to start trading!
Originally published at https://www.okex.com on August 28, 2020.

was originally published in OKEx Blog on Medium, where people are continuing the conversation by highlighting and responding to this story.