Over the past couple of weeks — as Bitcoin (BTC) has once again traded well above the $10,000 level — market participants are naturally questioning Bitcoin’s ability to grow further. Given bullish market conditions, analysts are asking the question of whether current prices are overextended or fundamentally supported.
While addressing such questions around an asset’s performance would typically require data not always publicly available, Bitcoin’s case — given its decentralized public ledger — is particularly unique. In this instance, we have access to troves of on-chain data, which can, when analyzed, provide useful clues as to what the future may hold for the leading digital currency.
To this end, OKEx Insights has collaborated with blockchain analytics company Catallact to present and discuss various on-chain datasets that can shed more light on future market behavior and expectations for Bitcoin’s price.
Bitcoin’s price — Why we care
Bitcoin remains a polarizing topic in terms of its utility and prospects in a world that has arguably only ever known centralized financial systems on a mass scale. Proponents claim it will change the way we hold and transfer wealth, while detractors argue it will never supplant currencies issued by central banks.
Philosophical questions aside, however, the one unignorable and utterly riveting aspect of Bitcoin — that has dominated headlines across major media and forced traditional banks, regulators and financial bodies to take note — is its price.
Given how BTC traded under a dollar in 2010, its rise over the years has triggered skepticism, disbelief, criticism, regulatory action, regional prohibitions and, finally, acknowledgment, as it became the best investment of the decade stepping into 2020.
With such unprecedented gains, Bitcoin made millionaires out of early backers and, unsurprisingly, gained a cult following, of sorts. The leading cryptocurrency has become a daily topic of discussion and debate across social media channels — most notably Twitter, the crypto-focused part of which is affectionately (or bitterly) known as Crypto Twitter — or just “CT.”
The link between price and market behavior
The price of any asset, including Bitcoin, at any given time, is more than just a trading figure. It represents the consensus of market participants and marks the threshold where bids (i.e., the maximum price a buyer is prepared to pay for the asset) meet asks (i.e., the minimum price that the seller is prepared to take for the asset). However, beyond the obvious, an asset’s price also inherently affects market behavior and psychology due to one basic rule: Market participants universally want to buy low and sell high. This assumption will hold true for any rational trader or investor, and it is generally what drives markets.
The pursuit of profitability is what gives importance to every participant’s entry, or the price at which they buy an asset. If a trader bought Bitcoin at $10,000, that price becomes their entry for that position and serves as the reference point for the trader’s profitability.
In this example, the trader will naturally seek to sell Bitcoin above $10,000 and will, most likely, hold on to the asset through downturns — for as long as possible — to at least reach a breakeven point and avoid a loss. On the other hand, if Bitcoin stays above $10,000 for a while — thus profiting the trader — they are likely to add more to their position if Bitcoin falls back to $10,000 in a corrective move. This behavior, when exhibited on a large scale, depicts what technical analysts identify as support and resistance zones.
If a significant number of traders establish their positions at a certain price level, they are less likely to sell below that price and more likely to add to their positions if the asset corrects after a period of growth. On the other hand, the same traders will be reluctant to add to their positions if the asset drops notably below their entry price, prompting them to sell at the first sign of recovery to breakeven and exit the trade.
The former behavior fuels price appreciation and the formation of support levels while the latter suppresses any upward movements and establishes resistance zones. This is an important point to remember as we discuss various upcoming Bitcoin market datasets.
Overview of Bitcoin accounting and UTXOs
As publicly available record-keeping ledgers, blockchains are especially suitable for in-depth accounting and data analyses. Firms like Catallact are able to extract a variety of on-chain data points from the Bitcoin blockchain to populate, correlate and chart visual representations of the network’s state, as well as the market’s past behavior and current standing.
Most price-related analyses, like the ones in this report, rely on blockchain accounting to identify the origins of coins — i.e., when the coins were first mined or last moved — with their corresponding market prices and their current state (such as whether they are unspent or not). This, for Bitcoin (and the coins that have hard-forked from it), means looking at unspent transaction outputs, or UTXOs.
Every Bitcoin transaction has an input (the sending address), outputs (the receiving addresses) and UTXO records. When a Bitcoin address receives a sum of BTC, the sum is recorded as a UTXO. Once that received BTC is sent in a new transaction, it is considered consumed or spent. What this means is simply that UTXOs represent the active coin balances available for a given address to spend.
The screenshot below, taken from the Blockchain.com explorer, shows a random transaction with its input and outputs, which were, at the time, unspent by the receiver.
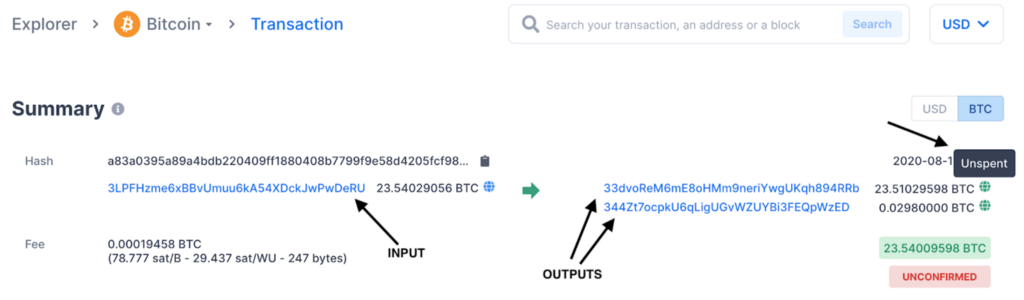
The 23.51 BTC in the transaction above represents one of the outputs, which is now recorded on the blockchain, along with its time of creation and value in USD at the time. This record is then available to be used as a reference point for that particular BTC sum in the future. As long as this 23.51 BTC remains unspent by the receiver, it is possible to calculate the unrealized profit or loss of this sum — looking at market prices and comparing them to the price of BTC when the output was received. Once the BTC is sent out in another transaction, it becomes spent, and it is similarly possible to calculate the realized profit or loss.
Monitoring UTXO data across the entire Bitcoin blockchain is at the core of the datasets we will discuss below.
It should be noted that the UTXO model is not applicable to all coins or networks. For example, Ethereum uses an account-balance model to assign ownership. For the purposes of this report, however, all data will be referencing Bitcoin UTXOs.
UTXO locations — Identifying position buildups
Identifying the locations of UTXOs on the blockchain in relation to Bitcoin’s price can give us a quick, insightful view of long positions (since they are by nature unspent) and their entry prices.
The chart below, provided by Catallact, visually represents the number of UTXOs at various price points over time (since 2015) and serves as a good indicator of established positions and their sizes.
At a glance, we can see two major clusters of UTXOs, represented by pink dots: the first around December 2018 and the second throughout late July and early August 2020.
The first cluster, from December 2018, was formed around the lowest point of Bitcoin’s bearish spell following the 2017 mania. It generally reflects how market participants, at the time, felt Bitcoin was attractive at sub-$5,000 prices.
Zooming into that time frame in the chart below, from August 2018 to July 2019, we can see how other UTXO clusters are relatively very small (most notably as BTC moved up to $10K and beyond) compared to the cluster formed between $4,000 and $3,400 in December 2018. This indicates that there was a lack of confidence at that time in the price growing much above $10K.
Jumping ahead to more recent time frames, as shown in the chart below, we can see that the March 2020 crash was not considered a conclusive bottom compared to December 2018, given the relatively smaller size of the UTXO clusters.
However, there is a visible increase in the number of positions established as the price crossed $10,000 in late July and early August 2020, suggesting that investors and traders who were on the fence jumped in to buy once this resistance level was breached.
In summary, these UTXO locations reflect a recent shift in sentiment, where market participants who were skeptical following the March 2020 crash waited for Bitcoin to pick a direction before buying. The relative size of UTXOs established around current price levels clearly reflects relatively higher market confidence in the recent move above $10,000 as compared to the run-up to the same level in 2019.
Changes in UTXO holdings — Reflecting market expectations
While UTXO locations over time, as shown above, allow us to identify market sentiments around major price movements, observing recent changes in UTXO holdings can help corroborate some of those findings.
The chart below tracks changes in UTXO holdings between June 15 and Aug. 6, 2020. The blue lines represent new positions established at the corresponding prices, while the pink lines represent positions — with their original entry prices — that were closed in the same period.
The chart above shows how a number of positions, originally established around $6,200, were closed in the seven weeks between June 15 and Aug. 6. These were followed by the closing of positions established at $8,700 and $9,700 — meaning traders sold their BTC to take profit. On the other hand, relatively larger new positions were established leading up to $10,000 and then again between $11,000 and $12,000, as the blue lines indicate.
The closing of older positions during a bullish spell reduces some downward pressure on the price as long-term market participants realize their profits and exit those trades. This leaves behind traders and investors with higher entry prices or newly established positions at current price levels. These new positions then contribute toward the formation of a floor or support zone for the price, which, in this case, is likely to form around the $10,000 level — supporting our findings in the previous section.
Realized profits and losses — Revealing market assumptions
Just as UTXOs reflect unrealized profits and losses in that they are unspent, spent outputs can be analyzed to calculate realized profits and losses at various price points. While profit-taking is a natural market phenomenon, extreme values — for both realized profits and realized losses — may hint toward imbalances in the market.
The chart below shows realized P&L (in USD terms) at various times as well as prices of BTC over the last four years.
There are two notable spikes here: the first representing realized profits (green) in December 2017 (near Bitcoin’s all-time high of over $20,000) and the second showing realized losses (red) during the March 2020 crash.
In hindsight, buyers in the first instance and sellers in the second instance were greatly disadvantaged. The extreme profit-taking in 2017 reflected a “now-or-never” attitude, showing a lack of confidence in the price levels holding or appreciating. On the other hand, the extreme loss realization in March 2020 was reminiscent of a “do-or-die” scenario, reflecting fear and desperation.
Looking at more recent time frames, however, we can see that the losses triggered by the March crash gave the market some relief, as realized losses dropped to insignificant levels after the large spike due to the fact that panic-sellers had already exited the market.
Similarly, instances of profit realization have also been significantly low in recent months, meaning fewer traders and investors are selling — i.e., exiting their profitable positions. This is especially notable when compared to June and July of 2019, when Bitcoin was trading roughly between $8,500 and $14,000.
This trend of low realized profits can be attributed to market maturity, and it shows that traders and investors are not in a rush to cash out now like they were in 2017, when the rally was deemed by many as a one-off event. The lack of realized losses, on the other hand, can be attributed to so-called weak hands leaving the market at the first signs of panic and paving the way for price appreciation.
The very fact that market participants are not scrambling to take profits at current levels — as they did in the past at these same levels — points toward a shift in market mentality and expectations. Traders and investors clearly don’t think current levels are unreasonable or unsustainable.
Unrealized profits and losses — State of the market
While we noted the declining trend in realized P&L over the last few months, studying the ranges and proportions of unrealized profits can provide further insights and help verify our findings and assumptions.
The chart below shows the proportions and price ranges of UTXOs that are in the money (i.e., in profit) or out of the money (i.e., in loss) over time.
There are three main periods of interest indicated on this chart in terms of profit and loss — the 2017 peak, the 2019 bear-market bottom and the current price levels above $10,000.
In the first instance, the majority of positions were understandably in profit as the price nearly touched $20,000. In the second instance, Bitcoin had dropped below $4,000, putting most positions in the red — or, on the above chart, pink. In the third, more recent instance, however, the proportion of coins in profit is relatively high, while those in loss are few — even though the price is still lower than 2019 highs.
This recent pattern of unrealized profit and loss following the March 2020 crash can be attributed to two main factors: Traders in loss already closed their positions, realizing their losses, and traders who bought BTC at relatively low prices during and after the crash are now easily in profit.
The very fact that realized profits are also low, as shown earlier, despite nearly all open positions being in profit at current levels, indicates that market participants are anticipating even bigger gains in the mid- to long-term.
SOPR — An indicator of market trends
The spent output profit ratio, or SOPR, essentially shows whether market participants are, on average, selling their holdings at a profit or not. A ratio above 1 indicates, on average, profitable spending, and figures below 1 reflect selling at a loss.
This ratio can be used as an indicator of market trends because of the way traders and investors typically behave (i.e., seeking profits and minimizing losses).
In a bullish market, when market participants expect the price to grow, they are unlikely to sell their holdings for a loss. This results in the SOPR staying at or above 1 for the duration of the bullish spell. Similarly, in a bear market, traders and investors wait to break even and exit, resulting in selling pressure as the SOPR reaches 1, pushing it back down again.
The chart below exhibits this behavior with the SOPR during the bear market of 2018–2019. The orange box highlights how the ratio remained below 1 during most of this bearish spell — meaning most people were selling at a loss — due to the pressure of selling at break-even prices.
Alternatively, if we look at the SOPR over the last few months, as shown below, we can see how the value has stayed above 1 mostly, indicating that market participants are optimistic about the price trend and are waiting to be in profit before selling.
Visit https://www.okex.com for the full report.
If you found this analysis insightful, you can view, download and share the PDF version of this report below:
Disclaimer: This material should not be taken as the basis for making investment decisions, nor be construed as a recommendation to engage in investment transactions. Trading digital assets involve significant risk and can result in the loss of your invested capital. You should ensure that you fully understand the risk involved and take into consideration your level of experience, investment objectives and seek independent financial advice if necessary. OKEx Insights presents market analyses, in-depth features, original research & curated news from crypto professionals.

was originally published in OKEx Blog on Medium, where people are continuing the conversation by highlighting and responding to this story.