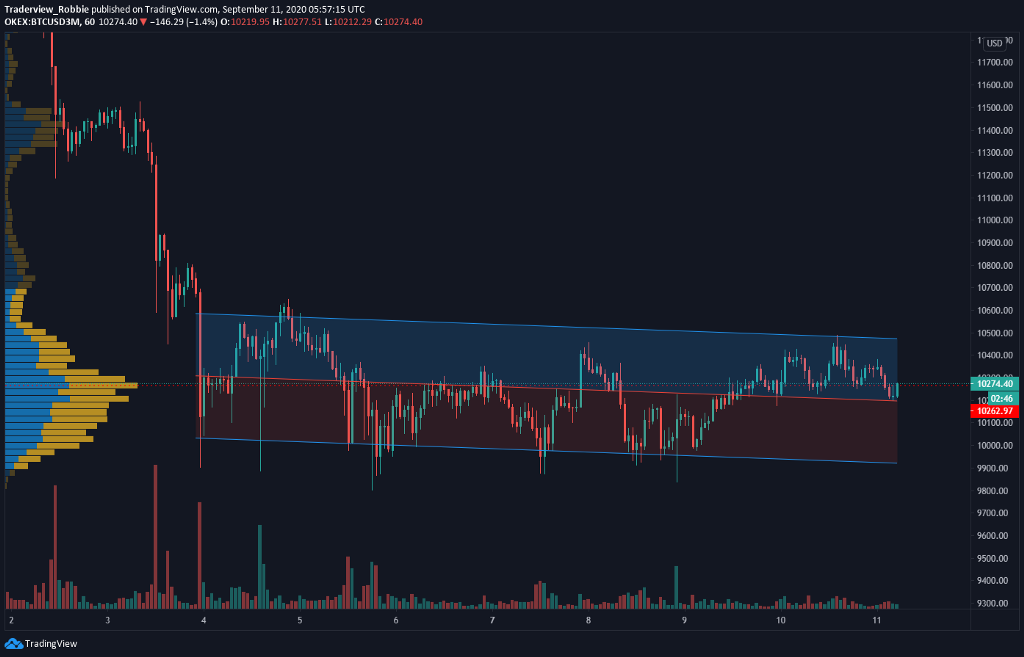
The realized volatility was consistently hovering around 2.5% this week, below the average value of 3.1%. The implied volatility, on the other hand, improved by 0.3%, but prices appear to have stagnated for now.
Looking at OKEx trading data, the long/short ratio has risen in several price-bottom formations. However, after the price stabilized around $10,200 this time, the ratio gradually declined, indicating that traders are less confident about further price increases. Furthermore, the continuing decline in the margin lending ratio indicates that fewer people in the market are willing to pay interest for borrowing Bitcoin these days. Open interest remains at a lower level compared to last month, and the negative quarterly futures premium shows an overall bearish market sentiment.
OKEx trading data readings
Visit OKEx trading data page to explore more indicators
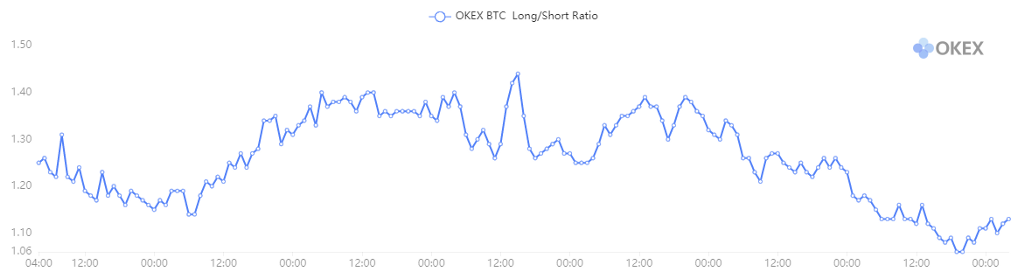
BTC long/short ratio
In this sideways trend, the long/short ratio is relatively volatile, running between 1.05 and 1.45. This ratio peaked on Monday and then began a gradual decline to its current value, near 1.1. While BTC rebounded in the second half of the week and ran above $10,000, retail traders were not impressed by the rebound, and more of them went short.
It is also interesting to note that the long/short ratio improved significantly when prices tested the key support at $9,800 several times, indicating retail traders perceived the support as more solid and were willing to open longs at lower prices.
The long/short ratio compares the total number of users opening long positions versus those opening short positions. The ratio is compiled from all futures and perpetual swaps, and the long/short side of a user is determined by their net position in BTC. In the derivatives market, whenever a long position is opened, it is balanced by a short position. The total number of long positions must be equal to the total number of short positions. When the ratio is low, it indicates that more people are holding shorts.
Overall, the gradual decline in the long/short ratio indicates that market confidence remains low.
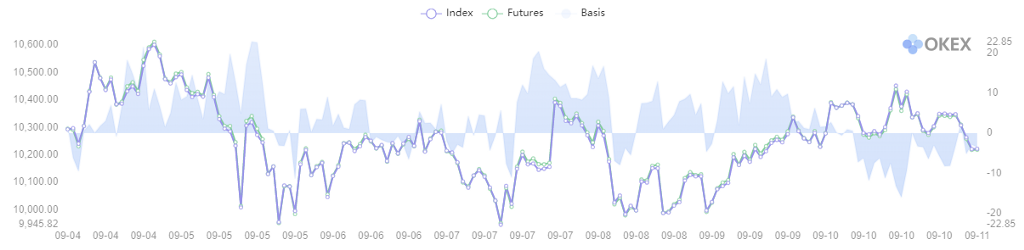
BTC basis
In the last week, we saw the BTC basis between quarterly futures and spot prices slip into negative territory for the first time since mid-May. This trend has persisted, with the quarterly contract dropping to a negative 0.16% on Thursday.
This indicator shows the quarterly futures price, spot index price and also the basis difference. The basis of a particular time equals the quarterly futures price minus the spot index price. The price of futures reflects the traders’ expectations of the price of Bitcoin. When the basis is positive, it indicates that the market is bullish. When the basis is negative, it indicates that the market is bearish. The basis of quarterly futures can better indicate the long-term market trend. When the basis is high (either positive or negative), it means there’s more room for arbitrage.
The current quarterly futures will expire at the end of September, and time decay can be one reason for the declining premium, but more of it can be attributed to the fact that market participants are not positive about the mid-term trend.
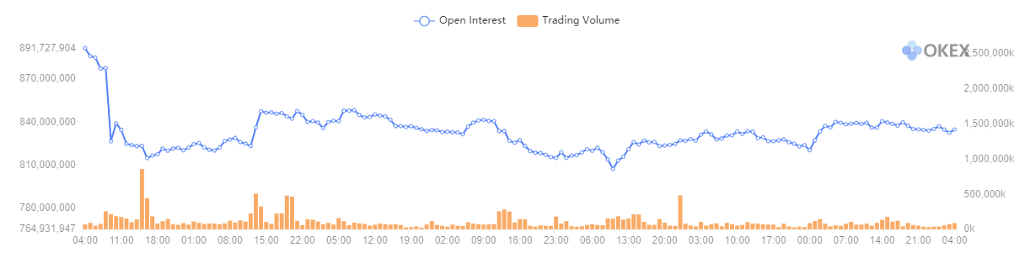
Open interest and trading volume
Open interest is the total number of outstanding futures/swaps that have not been closed on a given day. Trading volume is the total trading volume of futures and perpetual swaps over a specific period of time. If there are 2,000 long contracts and 2,000 short contracts opened, the open interest will be 2,000. If the trading volume surges and the open interest decreases in a short period of time, it may indicate that a lot of positions are closed, or were forced to liquidate. If both the trading volume and open interest increase, it indicates that a lot of positions have opened.
Open interest hasn’t changed much after a quick drop to near $840 million last Friday. OI was down to its lowest level of the week, at $802 million, on Tuesday but has since bounced back to its current $835 million. Due to the smaller change in OI, there is no sign of the next big move, and if OI continues in this oscillating pattern, prices will likely remain sideways.
Visit https://www.okex.com/ for the full report.
Not an OKEx trader? Sign up and start trading today!

was originally published in OKEx Blog on Medium, where people are continuing the conversation by highlighting and responding to this story.