Technical Analysis 101 | What Are the 4 Types of Indicators?
Unlock the secrets of Technical Analysis (TA) for crypto trading. Explore key indicators in the categories of Trend, Momentum, Volatility, and Volume to predict market trends.
Ever found yourself scratching your head, trying to decode the world of Technical Analysis (TA)?
You're not alone.
But here's the thing: TA doesn't have to be as complex as cracking the Da Vinci code.
In fact, it can be your golden ticket to crypto trading success.
Let's demystify it, shall we?
Why Technical Analysis is Your Secret Weapon
Born in 18th-century Asia, TA has come a long way, evolving into a trusted methodology for forecasting market trends.
Unlike fundamental analysis —which often dives into an asset's intrinsic value—TA focuses purely on past market data.
Think price patterns and volume metrics, with a dash of mathematical calculations to spice things up.
Still with me?
Great.
Let's break down the four key areas that should be your focus in the world of TA: Trend , Momentum , Volatility , and Volume .
Trend Indicators: Your GPS for Market Movement
Think of trend indicators as your GPS in the jungle of market fluctuations.
They smooth out the erratic behavior of asset prices to identify directional trends.
Key Types of technical indicators and Their Roles :
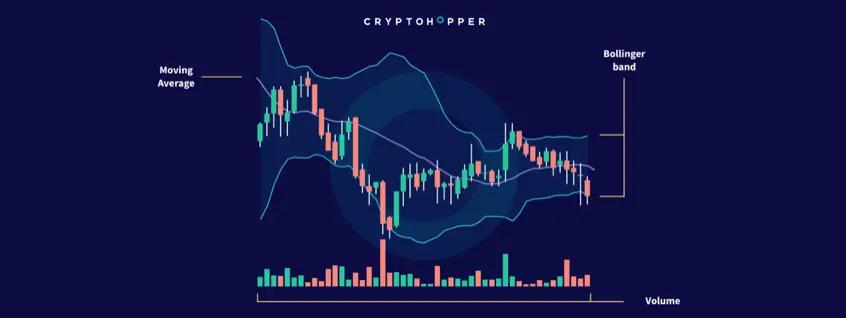
Simple Moving Averages ( SMA ) : The average of past prices over a specific period. It's like a mirror that reflects historical price movements, helping you identify overall price direction.
Exponential Moving Averages ( EMA ) : Unlike SMA, EMA gives more weight to recent prices. It's your 'right now' indicator, capturing the market's latest shifts.
Moving Average Convergence Divergence ( MACD ) : This is your go-to for spotting emerging trends. It measures the distance between two different EMAs, giving you clues on market momentum and trend strength.
Momentum Indicators: The Speedometer of Market Moves
These indicators measure the speed and intensity of an asset price change. It's like your car's speedometer but for financial markets.
Key Types and Their Roles:
Stochastic: This indicator ranges from 0 to 100 and shows you when an asset is overbought (above 80) or oversold (below 20). It's like your market thermometer.
Relative Strength Index ( RSI): Another 0-to-100 scale indicator, but it tends to be less sensitive than Stochastic. It's excellent for identifying extreme market conditions.
StochRSI: Think of this as your double espresso—it combines RSI and Stochastic to give you a more nuanced picture, alerting you about changes more rapidly.
Volatility Indicators: Your Market Mood Ring
Volatility is the rhythm of the market. High volatility is your fast-beat salsa music, while low volatility is more like a slow waltz.
Key Types and Their Roles:
Bollinger Bands: These bands expand and contract based on market volatility. If the bands widen, prepare for a roller coaster. If they narrow, it's more of a casual stroll.
Standard Deviation: This one shows you how far current prices have deviated from the average, helping you gauge market extremes.
Average True Range ( ATR): Consider this as your market seismograph, measuring market volatility by assessing the range of price movement.
Volume Indicators: Taking the Market’s Pulse
Volume is your 'peek behind the curtain' to gauge market enthusiasm or apathy.
The volume indicates the number of contracts/assets traded for a certain asset in a period of time.
These will help you measure the strength of a trend and its direction.
Traders like volume since, similarly to volatility, it creates trading opportunities.
On the other hand, they try to avoid low volume periods since the price might be ranging which may lead to either less profitable trades or negative ones.
Key Types and Their Roles:
Market Volume: This is your basic volume indicator showing you the number of shares, contracts, or assets traded within a set period—highly useful for spotting market peaks or valleys.
Money Flow Index ( MFI): Also known as "the RSI that accounts for volume". MFI is an indicator that combines volume and price to identify overbought and oversold zones
On Balance Volume ( OBV): Picture this as your market investigator. It combines price and volume to show you if the big money is buying or selling.
Your Next Steps: Mastery Awaits
Now that you've cracked the code, it's time to take the reins.
With Cryptohopper's arsenal of 130+ indicators and candlestick patterns, you're set to tailor the perfect trading strategy.
Ready to elevate your game? Start trading with Cryptohopper!